


Identifying Pro-Neoplastic Risks: Iron, B12, Folate Deficiencies
Part III: The Well-Appearing Patient: Laboratory Identification of Pro-Neoplastic Risk in Latent Iron, Vitamin B12, and Folate Deficiency
Glenn Tisman, M.D.1
- Retired Medical Oncologist, Independent Researcher, formerly Associate in Pathology, Columbia University; Fellow in Medicine-Hematology-Oncology, Bronx VA/Mount Sinai/Mt. Sinai Hospital Joint Program; Fellow in Medical Oncology, Keck School of Medicine, USC
OPEN ACCESS
PUBLISHED 31 December 2025
CITATION Tisman, G., 2025. Part III: The Well-Appearing Patient: Laboratory Identification of Pro-Neoplastic Risk in Latent Iron, Vitamin B12, and Folate Deficiency. Medical Research Archives, [online] 13(12). https://doi.org/10.18103/mra.v13i12.7183
COPYRIGHT © 2025 European Society of Medicine. This is an open-access article distributed under the terms of the Creative Commons Attribution License, which permits unrestricted use, distribution, and reproduction in any medium, provided the original author and source are credited.
DOI https://doi.org/10.18103/mra.v13i12.7183
ISSN 2375-1924
ABSTRACT
Background: A significant portion of the population harbors latent iron, vitamin B12, and folate deficiencies that are clinically silent and often missed by routine laboratory panels. These subclinical deficiencies can promote chronic oxidative stress and epigenetic disruption, increasing long-term cancer risk, yet a diagnostic gap remains for their early detection in asymptomatic individuals.
Objective: This review suggests a new, function-first diagnostic approach to uncover hidden micronutrient deficiencies in “well-appearing” patients. It offers a practical, evidence-based framework for clinicians to go beyond traditional screening cutoffs and detect pro-neoplastic metabolic risk before irreversible damage occurs.
Methods: We advocate for an updated diagnostic strategy that includes sensitive and functional biomarkers. This involves using a higher serum ferritin cutoff (<50 µg/L) to define early iron depletion, implementing a seven-step algorithm focusing on transferrin saturation (TSAT) and reticulocyte hemoglobin (Ret-He), and employing holotranscobalamin (holoTC) and renal-adjusted methylmalonic acid (MMA) to accurately assess vitamin B12 status, especially when total serum levels are indeterminate.
Findings: Using this advanced diagnostic approach can reveal a significant prevalence of non-anemic iron deficiency and functional B12 deficiency, which are typically overlooked. These functional markers provide a more accurate measure of tissue-level nutrient availability and metabolic effects, particularly in complex clinical settings such as chronic inflammation, heart failure, or kidney disease.
Conclusion: Transitioning to proactive, function-based laboratory evaluation is essential for modern preventive medicine. By detecting and addressing hidden micronutrient deficiencies early, clinicians can diminish the factors that lead to carcinogenesis, offering a genuine opportunity to intervene in the neoplastic process and potentially reduce cancer rates.
Keywords: Iron deficiency, Vitamin B12 deficiency, Folate deficiency, Cancer risk, Micronutrient deficiencies
Introduction
This Part III shifts the emphasis from mechanisms to patient care and medical laboratory analysis. The working premise is that biochemical derangements resulting from early, prolonged micronutrient deficiency or excess are often unrecognized in the clinic and on routine panels. Yet, they can drive oxidative stress and inflammation, remodeling cellular programs over time. Emerging work links micronutrient status to ROS burden, DNA repair vulnerability, and epigenetic regulation, providing plausible routes from subclinical imbalance to neoplasia.
Part III, therefore, focuses on latent deficiencies of iron, folate, and vitamin B12, and on how chronic, low-grade oxidative stress, often seeded by these deficiencies and sustained by inflammation, accumulates ROS, perturbs HIF/NF-κB/Nrf2 control, compromises DNA repair, and induces durable epigenetic changes that increase the probability of malignant transformation.
Traditional “Wellness” Diagnostics and Neoplastic Potential of Occult Iron Insufficiency
Screening practices for asymptomatic adults vary internationally. Many primary-care sources do not recommend a routine CBC as a screening test in asymptomatic, average-risk adults. This recommendation corresponds to a comprehensive guideline from major gastroenterology societies that explicitly discourages population-wide screening with complete blood counts (CBC) or iron studies (e.g., ferritin, TSAT) in asymptomatic, average-risk individuals. The guideline emphasizes that such screening lacks evidence of benefit and may lead to unnecessary follow-up, instead advocating for targeted testing based on clinical risk factors such as family history, symptoms, or comorbidities. Yet, early iron depletion is frequently silent, with normal hemoglobin levels, i.e., non-anemic iron deficiency (NAID), and requires iron studies to detect.
Herbert’s premise: Decades earlier, he advocated for universal iron-status testing to detect both early depletion (Stages I–II negative balance) and early positive balance or overload, highlighting that abnormalities can exist without anemia or symptoms.
Oncologic implications at both extremes: At the deficiency end, Plummer–Vinson syndrome, characterized by dysphagia, iron-deficiency anemia, and proximal esophageal webs, is linked to upper aerodigestive squamous cell carcinoma, particularly in the post-cricoid/hypopharynx and proximal esophagus. At the excess end, hereditary hemochromatosis with hepatic iron overload increases the risk of hepatocellular carcinoma, especially in the presence of cirrhosis.
Benign oral lichen planus lesions are associated with dysplastic transformation, which can evolve over several years into malignant squamous cell carcinoma of the oral cavity. Iron deficiency is recognized as a significant cofactor that creates a pro-oxidative, immunologically vulnerable oral microenvironment, contributing to dysplastic changes and increased risk of malignant transformation in chronic oral lichen planus. Clinical reviews and cohort studies have shown that iron deficiency is correlated with oral mucosal atrophy and impaired epithelial repair, thereby facilitating the progression of lichen planus lesions toward squamous cell carcinoma in susceptible individuals.
Iron deficiency exacerbates mucosal damage in the setting of chronic acid and bile reflux. It impairs epithelial regeneration and increases oxidative stress, which promotes genomic instability in the metaplastic columnar epithelium of Barrett’s esophagus. Patients with iron deficiency anemia and GERD have a significantly higher risk of esophageal adenocarcinoma (HR 2.3, 95% CI: 1.7–3.1). Iron deficiency is linked to hypoxia-inducible factor upregulation and mitochondrial dysfunction, supporting its role in carcinogenesis.
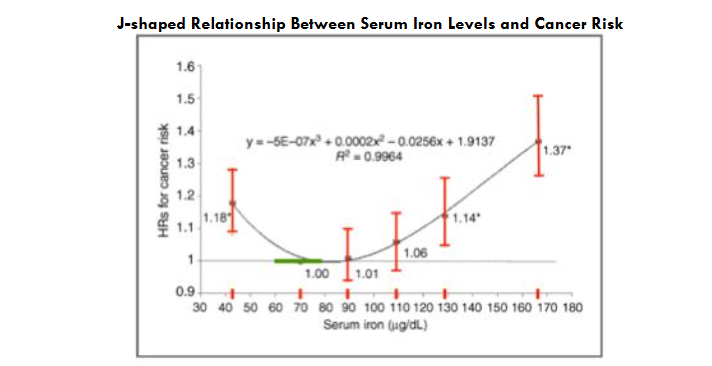
Population data reveal a non-linear risk of iron-associated malignant transformation. In a nationwide Taiwanese cohort of 309,443 cancer-free adults followed for a median of 7.07 years (8,060 incident cancers; 3,066 cancer deaths), baseline serum iron showed a J-shaped association with cancer: the lowest risk at 60–79 μg/dL, with higher risks both <60 μg/dL and ≥120 μg/dL.
Rationale for a New <50 µg/L (<50 ng/mL) Ferritin Decision Limit
Serum ferritin (SF) reflects iron stores; depletion precedes anemia and defines iron insufficiency. Traditional cutoffs (e.g., WHO’s <15 µg/L) are specific but insensitive and miss substantial non-anemic iron deficiency (NAID). A practical decision limit of <50 µg/L aligns better with physiology: as ferritin approaches ≈50 µg/L, hepcidin falls toward ≈3 nmol/L, ferroportin degradation is minimized, and fractional iron absorption rises sharply, as shown in stable-isotope studies in young women and supported by dosing–hepcidin coupling data.
In parallel, sTfR increases, and composite indices like sTfR/log ferritin enhance classification, especially when inflammation confounds ferritin. Guidance from the U.S. society has not universally adopted 50 µg/L; for example, the AGA recommends 45 µg/L when diagnosing iron deficiency in anemic adults, prioritizing sensitivity/specificity trade-offs. In patients with inflammatory signals, upward adjustment is appropriate, often paired with TSAT <20% and functional markers. Position papers and reference-interval analyses suggest that a sex-neutral <50 µg/L decision limit can simplify practice and improve early identification, especially in women, without materially over-pathologizing men when interpreted contextually.
Addressing a common objection: Critics note that adopting <50 µg/L could increase iron deficiency classifications (≈50% of women; ≈14% of men), but this highlights the underlying problem: physiologic and symptomatic consequences often occur at ferritin values >15–30 µg/L, so lower historical cutoffs perpetuate underdiagnosis and delay intervention.
From Iron to One-Carbon Metabolism: Integrated Evaluation of Iron, Vitamin B12, and Folate in Contemporary Practice
As increasingly sensitive functional and regulatory biomarkers, TSAT, Ret-He/CHr, sTfR, and hepcidin permit earlier diagnosis, interpretation becomes more complex in the presence of inflammation and comorbidity. Accordingly, this review devotes greater depth to iron deficiency, its pathophysiology, staging, and test interpretation, while also providing complete coverage of vitamin B12 and folate (mechanisms, clinical recognition, testing, and early neuropathy detection).
Vitamin B12 and folate are not overlooked: their mechanisms, clinical signs, and laboratory evaluation, including methylmalonic acid (MMA), homocysteine, the combined B12 index (cB12), and holotranscobalamin (“active B12”), together with strategies for early detection of peripheral neuropathy, are addressed in dedicated sections. We also examine the concern that high folic-acid exposure in the setting of low B12 may mask hematologic changes and worsen neurologic injury. The relative emphasis reflects epidemiology and diagnostic complexity and is intended to help clinicians interpret the assays most likely to be encountered, and misinterpreted, in everyday practice.
Staging for Iron Deficiency: Including Incorporation of Newer Markers
(severity increases left → right)
| Marker (units) | Normal Iron Status | Stage 1: Iron Depletion (Latent) | Stage 2: Iron-Deficient Erythropoiesis (Pre-Anemia) | Stage 3: Mild Iron-Deficiency Anemia | Stage 4: Severe Iron-Deficiency Anemia |
|---|---|---|---|---|---|
| Ferritin (µg/L) | Normal | ↓ <50 (first to fall) | ↓↓ <30 | ↓↓↓ <15 | ↓↓↓↓ (often <10) |
| Serum Iron (µg/dL) | Normal | Normal | ↓ <50 | ↓↓ | ↓↓↓ |
| TIBC (µg/dL) | Normal | Normal or slight ↑ | ↑ | ↑↑ | ↑↑↑ |
| TSAT (%) | Normal (≥20) | Normal | ↓ <20 | ↓↓ <15 | ↓↓↓ <10 |
| Hepcidin (ng/mL) | Normal | ↓ (suppression begins) | ↓↓ (suppressed) | ↓↓↓ (very suppressed) | ↓↓↓↓ (often undetectable) |
| Ret-He/CHr (pg) | Normal (≥30) | Normal | ↓ <30 | ↓↓ | ↓↓↓ |
| sTfR (mg/L) | Normal | Normal | ↑ | ↑↑ | ↑↑↑ |
| ZPP (µmol/mol heme) | Normal | Normal | ↑ >70 | ↑↑ | ↑↑↑ |
| RDW (%) | Normal | Normal | Normal or slight ↑ | ↑ >14.5 | ↑↑ |
| Hemoglobin (g/dL) | Normal | Normal | Normal or slight ↓ | ↓ (<13 men; <12 women) | ↓↓ |
Table 1 Legend: Conventions and marker-specific notes. Conventions: arrows indicate direction/magnitude of change (↓, ↓↓, ↓↓↓; ↑, ↑↑, ↑↑↑); “Normal” refers to local reference intervals. Severity progresses left → right. Ferritin/TSAT: acute-phase sensitive—interpret with CRP/AGP; ferritin cut-offs may need to be higher during inflammation. Ret-He/CHr: specific analogues (Sysmex vs Siemens); values are not numerically interchangeable. Typical decision band ≈29–32 pg.; responds within ~1–4 days—trend on the same analyzer platform. sTfR: less affected by inflammation but rises with erythropoietic drive (e.g., ESA therapy, hemolysis, thalassemia, pregnancy). Consider sTfR/log ferritin (or sTfR-F) when ferritin is confounded. ZPP: increases early in iron-restricted erythropoiesis; method cut-points vary. Values greater than 70 µmol/mol heme (or greater than 40 µg/dL whole blood) support iron-restricted erythropoiesis; they are also elevated with lead exposure. RDW: analyzer-specific; >14.5% is a common flag and frequently rises before microcytosis/hypochromia. Hemoglobin: sex-specific thresholds shown; consider age, altitude, and pregnancy adjustments per local policy.
Table 1 reveals that, in response to iron insufficiency/deficiency, declining hemoglobin levels usually appear last, signaling a severe stage of iron deficiency. Dr. Herbert’s four-stage framework (1992) conceptualizes iron deficiency as a continuum of negative iron balance: early store depletion (Stages I–II) → iron-deficient erythropoiesis without anemia (Stage III) → overt iron-deficiency anemia (Stage IV). In this model, hemoglobin often remains normal until Stage IV; therefore, early detection relies on storage and functional indices rather than the CBC alone. Serum ferritin reflects iron stores, while transferrin saturation (TSAT) reflects circulating iron available for delivery to the marrow; together they identify Stages I–III before anemia appears. Table 1 summarizes Herbert’s stages and typical laboratory anchors; an expanded, contemporary version, incorporating Ret-He/CHr, sTfR, and ZPP, is provided in the Supplement.
Iron Deficiency: A Major Contributor to ROS Generation and Oxidative Stress
As noted in Parts I and II, oxidative stress and chronic inflammation are frequently harbingers of malignancy. Latent iron deficiency, also termed non-anemic iron deficiency (NAID), is marked by normal hemoglobin levels but depleted or insufficient stores. A serum ferritin level below 45-50 µg/L suggests early depletion, according to recent ferritin-iron-hepcidin dynamics; however, in patients with heart failure, higher levels are indicative of the same. This is supported by abnormalities in transferrin saturation (TSAT), soluble transferrin receptor (sTfR), or reticulocyte hemoglobin content (Ret-He/CHr). As noted, the diagnosis may be highly biochemically nuanced.
Patients may report fatigue, restless legs, or pagophagia, yet their CBC can appear normal. A central aim of Parts I and II is to equip clinicians with an oncologic rationale, grounded in oncogenic mechanisms, for evaluating occult micronutrient deficiencies. We focus on iron, vitamin B12, and folate, aiming to identify early, reversible metabolic injuries arising from unrecognized, disease-promoting pathways.
Deficits in these nutrients generate potent and dangerous ROS signals that stimulate neoplastic pathways with oncogenic potential. Unfortunately, such deficiencies can persist undetected for years, remaining clinically asymptomatic but metabolically active in individuals despite normal results on routine blood tests.
Iron insufficiency, including early/latent deficiency, is common in the United States and remains the most prevalent micronutrient deficiency worldwide. Absolute iron deficiency is a state in which body iron stores are depleted, as reflected by low serum ferritin levels (<30 µg/L in most guidelines, but newer data suggest <50 µg/L or <100 µg/L in the presence of inflammation) and low transferrin saturation, indicating a genuine lack of available iron. Functional iron deficiency, in contrast, occurs when iron stores may be normal or elevated. Still, iron is not adequately mobilized for erythropoiesis, most often due to hepcidin-mediated blockade in conditions such as chronic inflammation, cancer, or chronic kidney disease, resulting in low transferrin saturation despite preserved or elevated ferritin levels.
In NHANES 2017–2020, approximately 11% of U.S. adults had absolute iron deficiency and about 15% had functional iron deficiency, resulting in an overall prevalence of 26% for latent (non-anemic) iron deficiency. Importantly, using a serum ferritin threshold of <50 µg/L for iron deficiency would significantly increase classification rates, identifying iron deficiency in nearly 50% of women and 14% of men.
Uncovering patients with hidden and often chronic iron deficiency of all degrees without or with anemia in the presence of other disorders, such as CHF, cancer, infection, and kidney disease with or without dialysis, is frequently not an easy chore, especially if there are compounding concomitant deficiencies of folate or B12 as well.
Many of these patients remain in a latent phase for extended periods, often years, with normal hemoglobin levels and few or no symptoms. Regardless of whether they have concurrent micronutrient deficiencies like B12 or folate, they are on a course toward potential carcinogenesis. When combined with chronic inflammation, such as from obesity, alcohol use, or other external carcinogenic factors, this increases their risk, as extensively discussed in Parts I and II of the manuscripts. Therefore, it is crucial to investigate and identify hidden micronutrient deficiencies using available laboratory tests, which are often overlooked because routine labs in relatively asymptomatic patients typically show normal or only minor results in CBC and CHEM 20 tests.
Practical Algorithm for Diagnosing Iron Deficiency in Diverse Conditions
Why a Seven-Step Algorithm in 2025? Fifty years ago, “microcytosis on smear → iron deficiency” often sufficed. Today, the diagnosis is substantially more complex: latent/functional deficiency without anemia is common; ferritin is confounded by inflammation; polypharmacy, differing international expert consensus recommendations, IV iron, CKD/heart failure, and hemoglobinopathies blur classic patterns. A structured approach that centers TSAT + Ret-He/CHr, interprets ferritin with CRP/AGP, and uses sTfR as the tiebreaker is therefore required.
sTfR is a readout of erythroid iron hunger: when high, it signals upregulated transferrin receptor expression from iron-starved erythroid precursors and therefore supports actual iron store depletion despite confounding inflammation; when normal or low, it suggests adequate cellular iron or suppressed erythropoiesis, making pure inflammatory (functional) iron restriction more likely if TSAT is low but sTfR does not rise.
Purpose and scope. This seven-step algorithm provides a pragmatic, test-first framework to detect iron insufficiency and iron deficiency, both absolute (depleted body stores) and functional (iron sequestered by hepcidin and inflammation, driven primarily by interleukin-6 [IL-6]), across common clinical settings. It assumes standard adult reference ranges; prioritizes functional indices (TSAT and reticulocyte hemoglobin content, Ret-He/CHr; add sTfR or sTfR/log ferritin when available); and requires that ferritin be interpreted in the context of inflammation (CRP ± orosomucoid/AGP). Anemia is not required for diagnosis; early (latent) deficiency is common and clinically meaningful, often preceding hemoglobin decline. The algorithm is intended to support decision-making in primary care, cardiology, gastroenterology, oncology, and obstetrics, guiding timely iron repletion or evaluation for blood loss, malabsorption, or chronic disease.
The following is a useful series of seven steps that may help uncover obvious and hidden etiologies for iron insufficiency/deficiency.
- Initial Screening (order together)
- Ferritin + CRP for acute inflammation (± AGP/orosomucoid for chronic inflammation). Evaluate stained peripheral blood slide.
- Serum iron + transferrin (or TIBC) → calculate TSAT% = Serum Fe µg/dL / TIBC µg/dL × 100NOTE: Use TSAT immunoassay (serum iron ÷ 2 × transferrin in molar units)
- CBC with indices (Hb, RDW, MCV); peripheral smear if possible.
- Reticulocyte hemoglobin (Ret-He/CHr) is preferred, and treatment is mandatory in complex cases. ZPP is an optional early marker in the absence of lead toxicity; increases early like (Ret-He/CHr)
- Soluble transferrin receptor (sTfR) ± sTfR/log ferritin index (use when inflammation or discordance is present).
- Ferritin Assessment (stores)
- <15–16 µg/L → Absolute iron deficiency likely.
- 15–30 µg/L → ID likely; confirm iron-restricted erythropoiesis (IRE) with TSAT (<20%) and Ret-He/CHr (<29–30 pg) ± sTfR (or sTfR/log ferritin index).
- 30–50 µg/L → Early-signal zone; do not label ID without IRE confirmation (TSAT, Ret-He ± sTfR) and interpret ferritin with CRP/AGP.
- If CRP/AGP is elevated, ferritin may be misleadingly high, do not exclude ID; prioritize TSAT/Ret-He/sTfR.
- Evaluate TSAT (iron available to the marrow)
- <20% → iron-restricted erythropoiesis (IRE) likely.
- <16% → stronger evidence; <10% → severe restriction.
- >45% (fasting, no recent iron, normal transferrin level) → consider iron excess.
- Low transferrin states (liver disease, nephrotic syndrome, malnutrition) can artifactually elevate TSAT—measure transferrin concentration and reinterpret.
- Check Inflammation / Recent Iron Exposure
- CRP (± AGP = orosomucoid) to contextualize ferritin.
- Within 48–72 h of IV iron or transfusion, TSAT and serum iron may be unreliable—recheck TSAT/Ret-He after recovery and rely on Ret-He/sTfR for near-term function.
- Assess Functional Markers (confirm iron-restricted hematopoiesis (IRE)
- Ret-He/CHr: <29–32 pg → impaired iron incorporation into new RBCs (1–4-day window); rises within days of effective therapy.
- sTfR: elevated (assay-specific; often >8–9 mg/L) or high sTfR/log ferritin index → supports absolute ID, especially when ferritin is normal/high.
- Final Interpretation (classify)
- Absolute ID: low ferritin (for the clinical context commonly < 30-45 µg/L adults) + low TSAT <20% ± Ret-He low / sTfR high, with low CRP.
- Functional ID (inflammatory block): normal/high ferritin + TSAT <20% + evidence of inflammation (elevated CRP and/or AGP) or inappropriately normal-to-high hepcidin, with Ret-He usually low; sTfR may be normal or only modestly increased.
- Mixed ID: low ferritin + TSAT <20% with inflammation present (elevated CRP/AGP and/or high hepcidin), alongside Ret-He low and often sTfR high, indicating depleted stores plus inflammatory sequestration limiting iron delivery.
- Final Interpretation for Mixed / Special Contexts (add as indicated)
- CKD / Heart failure: ID can exist with ferritin 100–300 µg/L when TSAT <20% → emphasize TSAT, Ret-He, sTfR.
- Athletes and children should use population-specific ferritin cutoffs and rely on TSAT and Ret-He. Repeat testing should be done after 7–14 days of deload or recovery if training-related inflammation is suspected.
- Microcytosis with normal iron indices: evaluate hemoglobinopathies (Hb electrophoresis/HPLC; α-thal DNA if indicated); consider ZPP for lead/chronic inflammation.
- Malabsorption/occult blood loss: tTG-IgA (± total IgA) for celiac disease, H. pylori, occult blood testing = FIT/FOBT, gynecologic assessment, endoscopy/colonoscopy per risk. Long-term PPi ingestion. NOTE: Screen stool for hidden GI bleeding with FIT (fecal immunochemical test) or FOBT (guaiac). FIT is specific to human hemoglobin and less diet-affected than guaiac. A negative test does not reliably exclude GI sources in iron-deficiency anemia; use endoscopy when indicated.
- Refractory/unclear: if available, hepcidin (high = functional block; low = absolute deficiency), bone-marrow iron stain, TMPRSS6 (IRIDA phenotype).
Thresholds
- Ferritin: <15–16 = absolute ID; 15–30 = likely; 30–50 = early-signal → confirm iron-restricted erythropoiesis (TSAT <20%, Ret-He/CHr <29–30 pg ± sTfR). Elevated RBC ZPP
- TSAT: <20% (stringent <16%, severe <10%); >45% (fasting/no recent iron/normal transferrin) suggests iron excess.
- Ret-He/CHr: <29–30 pg → iron-restricted erythropoiesis (IRE); rises within days on therapy.
- sTfR: elevated (± high index) = supports, but does not by itself prove, absolute iron deficiency when ferritin is normal/high. Use it as corroborative evidence alongside TSAT, Ret-He/CHr, and clinical context.
Characteristics of Absolute/Functional/Mixed Iron Deficiencies
| Type of Iron Deficiency | Ferritin | TSAT | Retic He/CHr | CRP/AGP | sTfR |
|---|---|---|---|---|---|
| Absolute | Low | Low | Low | Normal | Elevated |
| Functional | Normal/High | Low | Low | Elevated | Normal / slightly elevated |
| Mixed | Low | Low | Low | Elevated | Elevated |
Table 2 Legend: Differentiating Absolute/Functional and Mixed Iron Deficiency
Applicability and Adjustments
The seven steps form a robust, universal framework, but not a one-size-fits-all rule set. They solve most cases when a few population-specific adjustments and add-ons are applied as needed.
When the 7 Steps Work As-Is
- General adult outpatients, oncology follow-up without active inflammation, and most inpatient evaluations, once IV iron/transfusion timing is accounted for.
- Make Ret-He/CHr and sTfR routine in complex cases, and always pair ferritin with CRP (± AGP = orosomucoid).
Situations Requiring Adjustments (What to Change/Add)
- A: Inflammation / CKD / Heart failure
- Ferritin levels can be elevated to 100–300 µg/L despite iron deficiency. Prioritize TSAT (<20%) + Ret-He; add sTfR (± index); deprioritize ferritin alone.
- B: Liver disease / nephrotic syndrome/malnutrition (low transferrin)
- TSAT can be artifactually “normal/high.” Measure transferrin concentration and reinterpret; lean on Ret-He + sTfR.
- C: Recent iron therapy or transfusion (<48–72 h)
- Serum iron/TSAT is unreliable in the short term. Repeat TSAT/Ret-He after the window; use sTfR to gauge demand.
- D: Pediatrics / Pregnancy / Athletes
- Use population-specific ferritin cutoffs and rely more on TSAT and Ret-He. In athletes, repeat testing after 7–14 days of reduced physical activity to offset training-induced inflammation.
- E: Microcytosis with normal iron indices
- Suspect hemoglobinopathies. Add Hb electrophoresis/HPLC (± α-thal DNA). Consider ZPP if lead or chronic inflammation.
- F: Unexplained or refractory deficiency
- Screen malabsorption/occult loss (tTG-IgA ± total IgA, H. pylori, occult blood loss with FIT/FOBT, gynecologic evaluation, endoscopy/colonoscopy per risk).
- If phenotype suggests, add hepcidin (high = functional block; low = deficiency), perform a bone marrow iron stain, and test for TMPRSS6 mutations (IRIDA = iron-resistant iron deficiency anemia).
- G: Bone marrow or production problems (e.g., MDS, aplasia, sideroblastic anemia)
- Iron metrics can be misleading. Raise suspicion earlier and proceed with bone marrow evaluation and disease-specific testing.
Bottom line: Anemia is not a prerequisite for iron deficiency. The seven-step scaffold works well in many settings but may require adjustments for specific contexts. Base decisions on function: TSAT + Ret-He/CHr; interpret ferritin with CRP ± orosomucoid (AGP). Use sTfR ± sTfR/log(ferritin) as a tiebreaker when results conflict. RBC ZPP increases early in iron-restricted erythropoiesis and lead exposure; it normalizes slowly after repletion, unlike Ret-He. Elevated lead levels can interfere with these results.
Implementation notes. Re-draw iron studies ≥48–72 hours after IV iron or transfusion and 7–14 days after intensive training in athletes. Add tests selectively: transferrin concentration (protein loss or malnutrition), hemoglobinopathy testing (microcytosis despite adequate iron), hepcidin in specialized labs (complex phenotypes resulting in non-standard iron profiles caused by coexisting conditions or timing effects, requiring advanced or adjunct testing and context-specific interpretation), malabsorption or bleeding workups, and bone marrow evaluation when production disorders are suspected.
Take-home: Follow the seven steps as the default pathway, then modify them based on the specific situation to efficiently identify both obvious and hidden causes of iron deficiency. Similar information is presented within the supplement as a series of three spatially displayed, easily reviewable Table formats.
Box 2: Iron Toolbox Pearls, Thresholds, Pitfalls, and Remedies
| Test | What it reflects | Typical decision bands* | Strengths | Pitfalls / confounders | Best use cases | When not reliable / what to do |
|---|---|---|---|---|---|---|
| TSAT(%) = 100 × (Serum Fe µg/dL÷ TIBC µg/dL) | Iron immediately available to marrow | <20% = IRE likely; <16% stronger; <10% severe. >45–50% (fasting, no recent iron) suggests excess | Functional snapshot; responds within days to therapy | Low transferrin (liver disease, nephrotic syndrome, malnutrition) can artifactually raise TSAT; recent IV iron/transfusion | Core “function” anchor with Ret-He | Avoid within 48–72 h of IV iron/transfusion: check transferrin concentration in protein-loss states |
| Ret-He/CHr (reticulocyte Hb content) | Iron delivery to newly made RBCs (1–4 d window); iron availability to erythropoiesis over the last ~3–4 days | <29–30 pg = iron-restricted erythropoiesis (IRE); rises within days with effective therapy | Early, treatment-responsive; less affected by inflammation than ferritin | Requires reticulocyte analyzer; assay differences exist | Second core “function” anchor with TSAT | Severe marrow failure/ESA timing may blur interpretation; trend with therapy |
| Ferritin | Storage iron | <15–16 µg/L = absolute ID; 15–30 likely; 30–50 early-signal zone (confirm with function): TSAT (<20%) + Ret-He (<29–30 pg) ± sTfR. | Specific for low stores when no inflammation | Acute-phase reactant (↑ with CRP/AGP, obesity, liver disease, malignancy) → can mask ID | Confirm depletion; staging | Always read with CRP ± AGP (orosomucoid); do not exclude ID solely on “normal” ferritin if CRP↑ |
| CRP ± AGP (orosomucoid) | Inflammation context | CRP >3–10 mg/L (lab-specific) = inflammatory signal | Explains ferritin discordance; guides reliance on function tests | Transient rises (infection, post-op) | Decide weight of ferritin vs function | If CRP markedly ↑, down-weight ferritin; prefer TSAT + Ret-He ± sTfR |
| sTfR (soluble transferrin receptor) | Tissue iron demand/erythropoietic drive | “High” = lab/platform-specific (commonly >8–9 mg/L) | Largely inflammation-resistant; helpful tie-breaker | ↑ with high erythropoiesis (ESA use, hemolysis, thalassemia, pregnancy) even without ID | Tie-break discordant TSAT–ferritin; detect absolute ID in inflammation | Interpret with context; if erythropoiesis high, corroborate with TSAT/Ret-He |
| sTfR/log ferritin index | sTfR/log₁₀(ferritin µg/L): high (>2) → IDA; low (<1) → ACD/AI; 1–2 = mixed. Caution if ferritin ↑ from inflammation; prefer TSAT+Ret-He. | For log10 formula: >2 ≈ IDA, 1–2 mixed/indeterminate, <1 ACD/AI (verify lab cutoffs) | Improves discrimination of IDA vs ACD/AI when inflammation is modest | Inherits ferritin bias—less reliable when CRP high or ferritin distorted (obesity, liver disease) | Distinguish IDA from ACD/AI; assess mixed ID | If CRP high or ferritin unreliable, prefer sTfR alone plus TSAT + Ret-He; repeat later |
| ZPP (RBC) | Heme synthesis failure from iron lack; increases with lead toxicity | Abnormal: >35–80 μg/dL whole blood or ZPP/heme >80 μmol/mol heme (lab-specific) | Early rise; useful in lead exposure; inexpensive | Slow to normalize after repletion; ↑ in inflammation and some chronic diseases | Suspected lead; screening when inflammation obscures other tests | Do not use to diagnose hemoglobinopathies; confirm with TSAT/Ret-He |
Table 3 Legend: Arrows indicate direction and magnitude (↓, ↓↓, ↓↓↓; ↑, ↑↑, ↑↑↑). Values represent decision bands, not reference intervals; confirm with your lab and trend on the same platform. Interpret ferritin and TSAT considering inflammation (CRP ± AGP): inflammation often increases ferritin and decreases TSAT, so decrease weight on ferritin when CRP/AGP are high and focus more on TSAT + Ret-He/CHr ± sTfR. Recent IV iron or transfusions (48–72 hours) invalidate TSAT/serum iron; check transferrin in conditions involving protein loss (nephrotic syndrome, severe liver disease, malnutrition). Ret-He (Sysmex) and CHr (Siemens) are similar but not numerically interchangeable; use one analyzer for follow-up. sTfR is relatively unaffected by inflammation but increases with erythropoietic activity (ESA therapy, hemolysis, thalassemia, pregnancy); confirm with TSAT/Ret-He. ZPP rises early with iron-restricted heme synthesis and lead exposure; cutoff points for methods vary, and normalization takes time after repletion. When markers conflict, prioritize functional indicators (TSAT, Ret-He/CHr) and repeat testing after correcting transient factors.
Box 3: Clinical Staging of Iron Deficiency (Stage I–IV): Biomarkers, Symptoms, and Management Pathways
| Stage | Description and Pathophysiology | Key Biomarkers and Lab Changes | Clinical Features and Symptoms | Progression and Management |
|---|---|---|---|---|
| Stage I: Early Depletion (Moderately Reduced Iron Stores) | Initial negative balance with reduced iron absorption (low hepcidin signaling), partial depletion of storage sites (liver, spleen, marrow macrophages). No functional impairments; compensatory rise in transferrin. Preclinical; may persist months–years. Responsible for ↑ROS production and ↑Oxidative Stress. | Serum ferritin: low (<30–50 µg/L; first to drop). Serum iron: normal (50–150 µg/dL). TSAT: normal (20–50%). TIBC: normal or slight ↑. sTfR: normal. Bone marrow iron: reduced (Prussian blue: <20% sideroblasts). | Asymptomatic; possible subtle fatigue if prolonged. No anemia or tissue effects. Common in at-risk groups (menstruating women, low intake). | Triggered by chronic low intake/loss. Progresses to Stage II if imbalance persists. Screen with ferritin; replete stores with oral iron (e.g., 60–120 mg elemental/day) over ~1–3 months. |
| Stage II: Severe Depletion (Stores Low, No Dysfunction) | Stores nearly exhausted (<10–20% of normal) but circulating iron still adequate via compensatory absorption. Latent deficiency — “iron-poor blood” without anemia. | Serum ferritin: very low (<15–20 µg/L). Serum iron: normal or low-normal. TSAT: borderline low (15–20%). TIBC: elevated (>400 µg/dL). sTfR: normal or slight ↑ (early demand). Bone marrow iron: absent or minimal. | Nonspecific: mild fatigue, reduced exercise tolerance, restless legs. No anemia (Hb normal). | Advances from Stage I with ongoing loss (e.g., GI bleeding). Progresses to Stage III as stores reach zero. Urgent ferritin testing: iron therapy prevents progression (full repletion in ~3–6 months). |
| Stage III: Iron-Deficient Erythropoiesis (Functional Deficiency, No Anemia) | Stores depleted; iron delivery to marrow insufficient for heme synthesis → ineffective erythropoiesis. Hb may remain normal for a time; new RBCs trend microcytic/hypochromic. | Serum ferritin: very low/undetectable (<10–15 µg/L). Serum iron: low (<50 µg/dL). TSAT: low (<15%). TIBC: markedly ↑ (>450 µg/dL). sTfR: ↑ (>8–10 mg/L; reflects marrow demand). Reticulocyte Hb (CHr/Ret-He): low (<28–30 pg). Hb: normal (women ≥12 g/dL; men ≥13 g/dL), MCV/MCH low-normal. | Weakness, cognitive fog. Hair/nail brittleness; pica. Higher infection susceptibility (immune effects). | From Stage II as erythropoiesis outpaces supply; to Stage IV with sustained deficit (weeks–months). Consider IV iron if oral fails; monitor sTfR and TSAT for response. |
| Stage IV: Overt Iron-Deficiency Anemia (Clinical IDA) | Profound negative balance → inadequate hemoglobin production. ↑Increased RDW → ↑Microcytic, hypochromic anemia with systemic hypoxia. | Serum ferritin: very low (<5–10 µg/L). Serum iron: very low (<30 µg/dL). TSAT: very low (<10%). TIBC: high (>500 µg/dL). sTfR: markedly ↑ (>10–15 mg/L). Hb: low (women <12 g/dL; men <13 g/dL; severe <8 g/dL). MCV: low (<80 fL); RDW high (>15%). Bone marrow: absent iron. | Fatigue, pallor, tachycardia, dyspnea. Glossitis, koilonychia; pica/geophagia. Complications: heart failure, developmental delay (children). | Typically follows Stage III with ongoing loss (e.g., heavy menses, malignancy). Treat aggressively: address source (e.g., endoscopy) plus oral/IV iron. Recovery: Hb in ~1–2 months; stores in ~3–6 months. ↑ Continual follow-up necessary to assure maintaining normal Fe balance. |
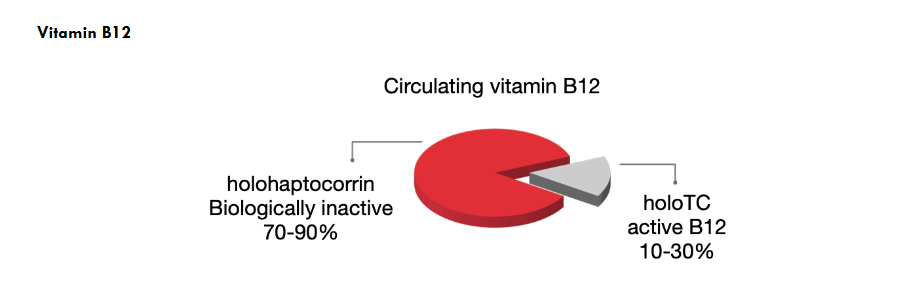
Figure 2 Legend: Circulating vitamin B12 fractions. Most serum B12 is bound to haptocorrin as (holohaptocorrin; biologically inactive for cellular uptake; ~70–90%), while a smaller portion is to transcobalamin as holotranscobalamin (holoTC), the only cellular B12-receptor deliverable, “active” fraction (~10–30%).
Adopt a practical diagnostic approach: normal total serum B12 levels do not exclude neural-cellular deficiency in patients showing symptoms or at risk; base decisions on holoTC with renal-adjusted MMA (use tHcy as a secondary aid), noting that MMA and Htcy can be normal early.
What has changed from the older practice? Earlier methods focused on a low total B12 level (often in the “indeterminate” range of 200–300 pg/mL [~148–221 pmol/L]) with variable increases in MMA and/or tHcy. These biomarkers did reflect progression toward hematologic conditions (e.g., megaloblastic anemia) and could coincide with neural damage (myelin issues, cognitive slowing). However, because thresholds were not based on functional outcomes (such as metabolic abnormalities like elevated MMA and tHcy and assay/platform differences exist), these strategies often missed subtle or early neurological issues, especially when total B12 was still considered “normal.”
Clinical implication
Use holoTC plus renal-adjusted MMA as the primary biochemical pair. Note: Artificial intelligence (AI) has already been effectively applied to model renal corrected methylmalonic acid (MMA) levels for renal function and vitamin B12 concentrations, improving diagnostic accuracy for vitamin B12 deficiency across variable kidney function. Reserve them to clarify folate and B6 confounding factors. Treat promptly when posterior column signs or other neurologic features are present and draw baseline labs, but do not delay therapy.
Older and latest clinical data support that B12 tissue deficiency is often present within the normal serum total B12 range. As evidenced by a 2005 ambulatory care cohort by Solomon, and the recent 2025 study by Beaudry-Richard et al., these studies together suggest that CNS involvement may occur at milder biochemical cobalamin insufficiency, indicating it occurs much earlier than hematologic abnormalities and elevations of MMA and tHcy.
In Solomon’s clinical series, patients who responded neurologically to B12 therapy had higher pre-therapy total B12 levels and less severe metabolic elevation than hematologic responders, which is consistent with neurological symptoms occurring at less severe B12 deficiency.
In the more recent Beaudry-Richard et al. study, community-dwelling normal volunteer older adults (average age 71 years) with B12 levels mainly in the standard normal range (≥415 pmol/L; ~563 pg/mL) still showed myelin-sensitive CNS abnormalities (e.g., delayed multifocal visual evoked potentials [mfVEPs], slower processing speed, increased white-matter hyperintensity) without any concurrent hematologic disease. This supports the idea that functional CNS injury can occur before noticeable hematologic changes and that the CNS may be more vulnerable or less well supplied at a given circulating B12 level.
Specifically, low levels of holoTC are associated with these changes, while high levels of holohaptocorrin are linked to biomarkers of neurodegeneration, such as Tau protein. Tau-driven axonal dysfunction can secondarily cause myelin loss. In some diseases, tau within oligodendrocytes can directly impair myelin biology, but tau itself is fundamentally an axonal protein, so elevations of tau reflect neuronal injury, not isolated myelin damage.
These early findings suggest that the diagnostic workup for B12 deficiency should extend to include functional and structural biomarkers (e.g., mfVEP, MRI, cognitive tests) and emphasize holoTC rather than relying solely on total serum B12 levels and elevations of MMA and homocysteine, which may or may not be associated with early decreased holoTC. While not pathognomonic on their own, the combination of low holoTC, mfVEP latency prolongation indicative of optic-pathway demyelination, and symmetric dorsal-column T2 hyperintensity of the cervical/upper thoracic cord by MRI (axial “inverted-V” sign) strongly suggests cobalamin-mediated neurotoxicity. In this cohort, major radiographic and biochemical mimics, including copper deficiency and nitrous oxide toxicity, were thoroughly excluded (based on serum copper/ceruloplasmin levels and exposure history) as well as vitamin E deficiency, HIV/HTLV-1, syphilis, hypothyroidism, and compressive myelopathy. Renal function was considered when interpreting MMA and tHcy.
Caution (functional threshold): Observational signals around roughly 553 pg/mL (~408 pmol/L) likely indicate a provisional neural risk zone rather than a fixed diagnostic cutoff; interpret with clinical context and supportive markers (e.g., holoTC, MMA).
Although preliminary, the study questions the adequacy of current “normal” B12 thresholds, emphasizing the need to confirm and refine these ranges to account for subclinical neurological damage, especially in older adults with serum B12 levels well within normal limits, up to 553 pg/mL (~408 pmol/L), as observed in the Beaudry-Richard study.
The following table offers a new comparison of the sequential B12 depletion over time, incorporating Beaudry-Richard’s findings, in relation to the Herbert standard progression of clinical B12 deficiency.
Herbert’s Classic Normal B12 deficiency progression.³²–³⁴ with inserted Beaudry-Richard- 2025 findings of B12-related early CNS demyelination³¹
| Parameter | ↑ Beaudry-Richard-2025 (New findings) | Herbert Classic Normal | Stage 2 | Stage 3 | Stage 4 | Stage 5 |
|---|---|---|---|---|---|---|
| Serum Total B12 Level | ↑ New findings: Detectable CNS demyelination by Visual Evoked Potentials, <553 pg/mL (~408 pmol/L) | Classic ≥300 pg/mL | 200–300 pg/mL | 150–200 pg/mL | <150 pg/mL | <100 pg/mL |
| (Holotranscobalamin = holoTC) Active B12 | ↑ Earliest to decrease <125 pg/mL (<92 pmol/L) | ~50–70 pg/mL (37–52 pmol/L) | 30–50 pg/mL, 22–37 pmol/L | <20 pg/mL | <12 pg/mL | <12 pg/mL |
| TC II % sat | >5% | >5% | 3–5% | <2% | <1% | <1% |
| ↑↑↑ Holohaptocorrin (holo-HC) | Approx ~400 pg/mL range | >150 pg/mL | >150 pg/mL | <150 pg/mL | <100 pg/mL | <100 pg/mL |
| dU Suppression | Normal | Normal | Normal | Normal | Abnormal | Abnormal |
| Hypersegmentation | No | No | No | No | Yes | Yes |
| TBC % sat* | >15% | >15% | >15% | >15% | <15% | <10% |
| Hap % sat* | >20% | >20% | >20% | >20% | <20% | <10% |
| RBC Folate | >160 ng/mL | >160 ng/mL | >160 ng/mL | >160 ng/mL | <140 ng/mL | <140 ng/mL |
| Erythrocytes | Normal | Normal | Normal | Normal | Normal | Macro-ovalocytosis |
| MCV | Normal | Normal | Normal | Normal | Normal | Elevated |
| Hemoglobin | Normal | Normal | Normal | Normal | Normal | Low |
| TC II | Normal | Normal | Normal | Normal | Elevated | Elevated |
| Methylmalonate | No | No | No | No | Yes | Yes |
| Nerve tissue/Myelin damage | ↑↑ Yes by very sensitive testing | No | No | No | Possible | ↑ Yes |
| Homocysteine | 8–12 µmol/L | 8–12 µmol/L | 8–12 µmol/L | ↑ Elevated | ↑ Elevated | ↑ Elevated |
Table 4 Legend:
† Holotranscobalamin (holoTC), the transcobalamin-bound, cell-deliverable B12 fraction, may decrease from a person’s previous baseline even while staying within the laboratory reference range and has been linked to microstructural brain changes (e.g., increased white-matter hyperintensity burden on MRI). A lower holoTC/total B12 ratio (indicating a smaller proportion of active B12) is associated with poorer cognitive performance (e.g., modified MMSE, delayed recall) and increased odds of cognitive impairment. In contrast, total B12 or holoTC alone may show no association. These findings support including holoTC (along with MMA/tHcy and renal function measures) in the assessment of early cognitive or neurologic symptoms to help guide timely B12 repletion, rather than relying solely on total B12 levels.
¶ Beaudry-Richard et al. identify a CNS-first “neural vulnerability zone” within the conventional B12 normal range, below approximately 408 pmol/L, where measures of central conduction and white matter defect injury precede overt serum thresholds (and sometimes before laboratory flags holoTC as low). This shifts the earliest detectable signal of B12 insufficiency from chemical cut-offs to sensitive CNS biomarkers.
Lower active B12 delivery is acknowledged factor in nervous system vulnerability (correlation, not proof of causality) because reduced holo-TC limits cellular B12 availability for myelin maintenance and neuronal metabolism. Claims of a specific total-B12 level at which damage must occur (e.g., 533 pg/mL) should be avoided unless supported by clinical outcomes.
††† Emerging evidence also links higher holohaptocorrin (holo-HC)—within nominally normal ranges—to biomarkers of neurodegeneration (e.g., serum tau), suggesting a possible U-shaped risk across the B12 transport spectrum. In a cohort of cognitively intact older adults, lower B12 measures (especially holo-TC) were associated with mf-VEP latency delays, age-related slowing of processing speed, and increased WMH burden, with effects becoming apparent below approximately 408 pmol/L (~553 pg/mL).³¹
Classic reference framework: hematologic progression can still be described using Herbert’s stages (1–5), but these clinical-neurologic associations suggest that tissue-level or compartmentalized dysfunction may occur before overt serum changes and classic hematologic findings.
Latent B12 damage may be compartmentalized, and in some highly sensitive cells, it may occur earlier than previously detected. Classic pathway: Herbert Classic Stages: (Normal = 1), 2, 3, 4, and 5. Review Table 5.
In 1987, Herbert observed that B12 deficiency often presents with subtle or even obvious nerve damage, especially when using a 256 Hz tuning fork to clinically assess vibratory and subsequent position sense of the second or index toe.
to detect subtle nerve damage in the absence of hematologic changes.³² He emphasized that because serum holoTC is depleted of vitamin B12 within a few days after absorption stops, measuring holoTC is the most effective screening test for early negative B12 status. HoloTC decreases below its normal range well before total serum vitamin B12, which primarily measures vitamin B12 on haptocorrin falls below normal limits (Figure 2).³³ He suggested that since Schilling test results are usually normal in the elderly (50 years and older) with lower-end B12 levels, the conclusion might be that many low serum B12 levels, frequently observed in the elderly, are due to testing errors. In reality, often normal Schilling test results can be misleading, and a low serum cobalamin level may actually signal developing pernicious anemia.³⁴ In his 1959 monograph on The Megaloblastic Anemias, he highlighted the diagnostic importance of early vibratory loss when a 256 Hz tuning fork is placed on the index toe, as opposed to the great toe (hallux), contrary to the clinical standard use of a 128 Hz tuning fork on the great toe. The loss of position sense in the index toe also appears to be an earlier indicator than that in the great toe.³⁵ The sensitivity of the 128 Hz tuning fork was found to decrease with advancing age and has been studied by J. M. T. Mellström.³⁶ Herbert emphasized that in cases of neuropathy caused by B12 deficiency, loss of vibratory perception with a 256 Hz tuning fork on the index toe occurs before the loss with a 128 Hz one. This pattern is also reflected in the earlier loss of position sense in the index toe compared to the great toe. If identified early during subacute combined neuropathy, typically within 6–12 months of first symptoms, these changes are usually reversible with B12 replacement therapy.
Clinical Action: Measure holoTC, MMA, tHcy, and renal function in symptomatic patients, even if B12 levels are in the low-normal range. Add a 256 Hz tuning fork to your toolkit alongside a 128 Hz fork when assessing for neural signs of subacute combined degeneration. Box 3
Folate
Latent folate deficiency is best identified through metabolic markers, as serum folate levels typically return to normal within a few days after supplementation. Elevated homocysteine or reduced red cell folate provides more substantive evidence of deficiency, with early mucosal changes and fatigue often preceding macrocytic anemia.³⁷
In all three micronutrients, toxic metabolites from latent deficiency offer an opportunity for early detection and prevention intervention, as deficiencies in these vitamins increase cellular-damaging oxidative stress. Missing early signals allows oxidative stress, impaired DNA repair, and epigenetic instability to accumulate, which may lead to malignancy and severe neural damage.³⁸
Folate Status — Staging Table (Victor Herbert Model)
| Parameter | Stage 1 Normal | Stage 2 | Stage 3 | Stage 4 | Stage 5 | Stage 6 |
|---|---|---|---|---|---|---|
| Serum Folate | >35 ng/mL | >5 ng/mL | <3–4 ng/mL | <3 ng/mL | <3 ng/mL | <3 ng/mL |
| RBC Folate | >200 ng/mL | >200 ng/mL | >200 ng/mL | <160 ng/mL | <120 ng/mL | <100 ng/mL |
| dU Suppression | Normal | Normal | Normal | Normal | Abnormal | Abnormal |
| Hypersegmented Neutrophils | Normal (<3.5) | Normal (<3.5) | Normal (<3.5) | Normal (<3.5) | Abnormal (>3.5) | Abnormal (>3.5) |
| Liver Folate | >3 µg/g | >3 µg/g | >3 µg/g | <1.6 µg/g | <1.2 µg/g | <1.0 µg/g |
| Erythrocytes | Normal | Normal | Normal | Normal | Normal | Macro-ovalocytosis |
| MCV | Normal | Normal | Normal | Normal | Normal | Elevated |
| Hemoglobin | Normal | Normal | Normal | Normal | Normal | Low |
| Plasma Clearance of IV Folate | Normal | Normal | Normal | Normal | Increased | Increased |
| Homocysteine | 7–10 µmol/L | 10–12 µmol/L | 10–12 µmol/L | Elevated | Elevated | Elevated |
Table 5 Legend: From Dr. Victor Herbert. Making sense of laboratory tests for folate status: folate requirements to maintain normal levels. Units are standardized to ng/mL and µg/g for consistency with U.S. and SI standards.³⁹ The dU suppression test, also called the deoxyuridine suppression assay, measures thymidylate synthase activity; failure to suppress deoxyuridine uptake (“abnormal”) indicates possible impairment in folate or B12 pathways.⁴⁰ Homocysteine levels should be interpreted considering renal function and B12/B6 status. Many labs consider levels above 12–15 µmol/L as elevated, and fasting samples help minimize dietary effects. Homocysteine levels are often slightly elevated in cases of hypothyroidism and when serum TSH is high.
New Patient Serum Folate Evaluation
Understanding Serum Folate in New Patients: What each test reflects.
Serum folate – temporary supply; varies with recent meals or supplements (hours to days).
RBC folate – longer-term tissue folate available at the time erythrocytes were formed; changes slowly (weeks) because mature RBCs cannot import folate.
Sampling tips (to prevent false normals or false highs)
Draw fasting and ask the patient to avoid folate supplements for 24–48 h (longer if high-dose).
Co-order: total B12 (± holo-TC), MMA (eGFR-aware), tHcy, CBC with smear.
Folate-Trap Principle (Why Interpretation Is Difficult)
In vitamin B12 deficiency, methionine synthase activity decreases, leading to folate becoming trapped as 5-methyl-THF, which renders THF unavailable for dTMP/purine synthesis.
Net effect: cellular “functional” folate deficiency despite normal or high serum folate; RBC folate is often low in B12 deficiency as well.
Clinical rule: Never treat with folate alone until B12 deficiency is ruled out to avoid masking hematologic signs while neurological damage progresses.
Typical result patterns and next steps
Low fasting serum folate plus low RBC folate suggests chronic folate deficiency or malabsorption.
Check medications (antifolates, phenytoin, Dilantin (folate more so than B12 deficiency), MTX), alcohol use, celiac disease/IBD, bariatric surgery history; confirm with elevated tHcy and normal MMA (if kidney function permits).
Normal/high serum folate + low RBC folate → Either early recovery after recent intake or B12 deficiency (folate trap).
Differentiate with MMA (↑ suggests B12 deficiency), holo-TC (low supports B12 under-delivery), and clinical signs; treat B12 first if uncertain.
Low serum folate with normal RBC folate → Recent dietary lapse or sampling issues; recheck fasting, review supplements/ethanol, consider repeat if clinical suspicion persists.
Both folate tests are normal, but tHcy is elevated → Consider B6 deficiency, hypothyroidism, renal impairment, or medications; reassess B12 with MMA/holo-TC.
Very high serum folate with symptoms → Think recent supplements/fortified foods, bacterial overgrowth, or liver disease; RBC folate clarifies chronic status.
Dynamics to Remember
RBC folate lags clinical change; it rises only as new RBCs enter circulation (weeks).
Transfusion, hemolysis, pregnancy, alcoholism, and leukocytosis can alter values; interpret in context and, if necessary, repeat after stabilization.⁴¹
Key Point
Use fasting serum folate to assess current supply and RBC folate for long-term status, but also screen for B12 deficiency (holoTC + MMA) concurrently because the folate trap can make serum folate appear misleading (falsely elevated) and cause RBC folate to seem low in B12 deficiency. Do not administer folate alone until the B12 level is confirmed.
Box 4
Folate Fortification’s Double-Edged Sword: Neurological Risks with Low B12 and the Dangers of Blind B12 Supplementation
Mandatory folic acid fortification has significantly reduced the incidence of neural tube defects (NTDs), demonstrating a clear population-level benefit. Simultaneously, converging historical, epidemiological, and experimental evidence suggests that excess folic acid, especially in cases of vitamin B12 deficiency, can negatively impact the nervous system and related health outcomes.⁴²
Historical evidence shows that in pernicious anemia, pharmacologic folic acid provided temporary hematologic improvement but was followed by neurologic and hematologic relapse when the underlying B12 deficiency remained untreated.⁴³
Mechanistic considerations propose mechanisms include folate-driven erythropoiesis increasing cellular B12 demand, worsening biochemical markers of B12 deficiency (elevated MMA/tHcy) when folate is high and B12 is low.⁴⁴˒⁴⁵ Renal and tubular handling pathways for folate- and B12-binding proteins (megalin/cubilin) underline potential interactions in vitamin reabsorption and trafficking, reinforcing biological plausibility.⁴⁶
Epidemiological studies indicate that in older adults, high folate levels combined with low B12 are linked to cognitive impairment and unfavorable B12-related biomarkers, with some groups showing worse cognitive performance under this combination.⁴⁴˒⁴⁷˒⁴⁹ Maternal research also suggests that extremely high maternal folate (and/or very high folate and B12 together) might be associated with a greater risk of autism in offspring. In contrast, proper periconceptional folate dosing appears protective, suggesting a U-shaped risk pattern.⁵⁰˒⁵¹
Experimental studies show that in rodents, both folate deficiency and excess can impair neurodevelopment, alter DNA methylation processes, and increase mutation rates; these effects are intensified when excess folic acid occurs alongside low B12 levels.⁵²˒⁵³
Genetic factors: Common polymorphisms in folate/B12 one-carbon metabolism (e.g., MTHFR 677C>T and others) modulate vulnerability to imbalances in folate/B12 status, suggesting interindividual variability in risk from excess folic acid exposure.⁵⁴
Transgenerational risks. Animal and human data point to folate-related epigenetic alterations in germ cells with consequences across generations, with both deficiency and high-dose supplementation implicated depending on timing and context.⁵⁵˒⁵⁶
Pragmatic implication. Several experts have argued that fortification policies should account for vitamin B12 status, either by pairing folic acid with vitamin B12 or by considering natural reduced folates (e.g., folinic acid, 5-MTHF) in place of synthetic folic acid where feasible, to preserve NTD prevention while minimizing neurologic risk in B12-deficient subgroups.⁵⁷˒⁵⁸ In line with caution, Green et al. emphasize avoiding blind supplementation with folic acid alone when B12 deficiency is possible, and extending that caution to indiscriminate pharmacologic-dose B12 supplementation. This is illustrated in a well-designed cut-off-based patient on active surveillance for prostate cancer whose tumor kinetics appeared to accelerate following B12 replacement, illustrating that indiscriminate B12 supplementation may also be unwise without clinical context.⁵⁹
Box 5
Initial Diagnostic Work-Up: Suspected Early/Latent B12–Folate–B6 Deficiency with CNS Risk³⁷
A — CORE TESTS (SINGLE PHLEBOTOMY DRAW)
-
Holo-transcobalamin (holoTC; “active B12”).
-
Serum total B12.
-
Methylmalonic acid (MMA), serum/plasma.
-
Total homocysteine (tHcy), plasma.
-
CBC with smear review (MCV, RDW, macro-ovalocytes, neutrophil hypersegmentation) ± reticulocyte indices.
-
Red-cell folate (prefer over serum folate for chronic folate status).
-
Serum creatinine/eGFR (materially alters MMA/tHcy interpretation).
B — IMMEDIATE INTERPRETATION LOGIC (ACTIONABLE)
-
tHcy ↑ with normal MMA → folate or B6 deficiency most likely; also consider hypothyroidism and renal effect.
-
Low/indeterminate total B12 with low holoTC (even if MMA/tHcy normal) → early/functional B12 deficiency plausible.
-
Normal total B12 but low holoTC with MMA and/or tHcy → functional B12 deficiency likely.
-
Low RBC folate with normal MMA → folate deficiency favored.
-
Smear showing macro-ovalocytosis/hypersegmented neutrophils → megaloblastic physiology likely.
C — REFLEX / ETIOLOGIC TESTS (PER HISTORY/RISK)
-
Anti-intrinsic factor Ab and anti-parietal cell Ab (± fasting gastrin and pepsinogen I/II) for pernicious anemia.
-
tTG-IgA with total IgA for celiac disease; Helicobacter pylori stool antigen or urea breath test if GI risk.
-
TSH (hypothyroidism can elevate MCV and tHcy).
-
Plasma pyridoxal-5′-phosphate (PLP) if tHcy with normal MMA (suspected B6 deficiency).
-
Urine MMA if CKD confounds serum MMA.
D — NOT RECOMMENDED FOR FIRST-LINE USE
-
TCII % saturation, holohaptocorrin, and dU-suppression are specialized assays that rarely change early management when holoTC, MMA, and tHcy are available.
-
Note: this does not refer to the routine holoTC assay itself (listed under Core tests).
Table 6 Legend: This single-draw work-up targets early/latent cobalamin, folate, and vitamin B6 deficiency and guides first reflex testing by likely etiology (A: Core tests; B: Immediate interpretation; C: Reflex/etiologic tests; D: Not recommended first-line). When available, holo-transcobalamin (holoTC, “active B12”) serves as a first-line transport marker and is best interpreted in conjunction with MMA, tHcy, and renal function (eGFR/creatinine). A sustained fall in a patient’s holoTC relative to prior baseline—even if still within the reference interval—can indicate early or compartmentalized B12 under-delivery before total B12 or metabolic abnormalities emerge. Many laboratory utilization resources and reviews list holoTC as an appropriate biomarker, particularly when diagnostic uncertainty exists or when MMA/homocysteine testing is unavailable or impractical.
Note: Renal impairment elevates MMA and tHcy; inflammatory and hematologic conditions may increase total B12 via haptocorrin. Interpret all results in a clinical context.
The cB12 (combined B12 index)
Note on the cB12 computation: The age-adjustment in published cB12 formulas is study-specific; use cB12 cut-points as exemplars rather than universal thresholds unless the exact model is specified.
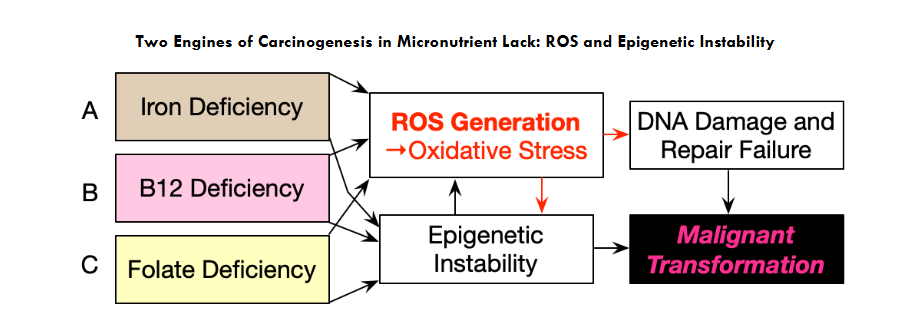
Figure 3 Legend: In folate/B12 deficiency
One-carbon flux slows → SAM ↓, SAH ↑ → methylation reactions stall.
Results: global DNA/histone hypomethylation with selective promoter hypermethylation, uracil misincorporation/strand breaks, reduced glutathione via impaired transsulfuration, and amplification of oxidative stress, all favoring malignant transformation.
-
Iron Deficiency:⁶⁹˒⁷⁵˒⁷⁶
-
B12 Deficiency:⁷⁷–⁸⁰
-
Folate deficiency:⁶⁴˒⁸¹
Micronutrient deficiencies, if present, often act in concert, dangerously tipping the balance of oxidative stress toward neoplastic cellular transformation, as shown in the following Figure 4.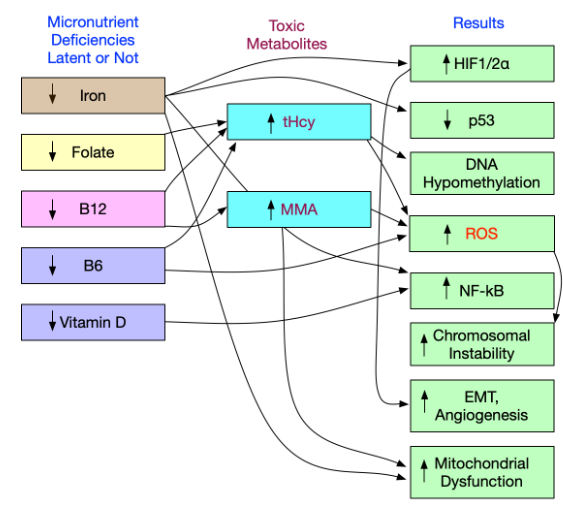
Figure 4 Legend: Multiple micronutrient deficiencies (including iron, folate, B12, B6) mimic radiation/chemicals by causing oxidative lesions and DNA strand breaks.⁸²
Latent or overt deficiencies in iron, folate, vitamin B12, vitamin B6, and vitamin D,⁸³–⁸⁶ converge on shared molecular pathways that amplify oxidative and inflammatory stress.⁶⁹ Folate, B12, and B6 deficiencies elevate Hcy, actively promoting oxidative stress;⁸⁷˒⁸⁸ B12 deficiency increases MMA, which actively fosters oxidative stress.⁸⁸ Iron deficiency stabilizes HIF-1/2 through prolyl-hydroxylase inhibition, and vitamin D deficiency reduces VDR/Nrf2 activity; together, these promote ROS and NF-κB activation. Downstream effects include p53 dysfunction, dysregulation of DNA methylation (global hypomethylation caused by iron-deficiency-related TET inhibition and focal hypermethylation), chromosomal instability, EMT with angiogenesis, and mitochondrial dysfunction; coexisting micro-deficiencies act additively or synergistically.
Conclusion — Clinical Synthesis
Latent micronutrient deficiencies, especially iron, vitamin B12, and folate, are common in both outpatient and inpatient care but are often overlooked when diagnosis depends on outdated cutoffs or single markers. A function-first approach that emphasizes TSAT and Ret-He/CHr, interprets ferritin in relation to CRP/AGP, and uses sTfR to resolve conflicting results detects risk earlier, guides more efficient confirmatory testing, and helps prevent irreversible damage. Structured, point-of-care algorithms and a small set of reflex tests implement this approach.
Mechanistically, these deficiencies shift redox set points, stabilize HIF signaling,⁸⁹–⁹¹ activate weakened Nrf2 defenses, and promote epigenetic “lock-in” of malignant traits.⁹² Clinically, laboratory studies should be interpreted physiologically, combining stores + availability + function: ferritin with TSAT (and Ret-He/sTfR when available) for iron, holoTC with MMA (contextualized to renal function) for B12, RBC folate with tHcy for folate, tHcy and PLP for B6, and 25-OH-vitamin D for vitamin D.⁹³ Practical priorities include treating B12 before folate when both are borderline, replenishing iron to safe physiological targets while addressing inflammation, and reassessing functional markers (MMA, tHcy, Ret-He) after repletion. Proactive identification and correction of these “micro-deficiencies” is a low-risk, high-yield strategy to reduce oxidative stress, restore genomic maintenance, and slow progression toward malignancy. The extended latency of carcinogenesis suggests that brief antioxidant supplementation trials may not align with the disease’s natural timeline, contributing to their negative outcomes.
Epilogue — Outlook and Research Agenda
This series builds on redox and hypoxia biology (Part I) and epigenetic persistence (Part II), leading to bedside implementation (Part III). Clinicians and paramedical staff should monitor and consider lab data trends, noting subtle, early changes in lab results, even within reference ranges, as these often provide the first diagnostic signals and an opportunity to prevent irreversible disease.
The shift toward context-driven algorithms and serial monitoring is supported by guidelines that promote proactive assessment of iron and vitamin B12 status, emphasizing that early biochemical changes often precede anemia and clinical symptoms.¹³ The integration of such protocols into electronic records systems to trigger reflex testing based on initial results is outlined in studies on precision diagnostics, which demonstrate improved detection of non-anemic iron deficiency²⁷ and early neuropathic changes in B12 deficiency. These approaches align with the concept of pre-disease detection, where trajectory-based monitoring enhances preventive care and reduces long-term morbidity.⁶
Key questions deserve prospective testing. If corroborated, findings associated with Alexandra Beaudry-Richard and with Solomon³⁰ imply that current “normal” B12 ranges may be overly permissive. Folic-acid fortification, while beneficial for neural tube defects, could exacerbate neural vulnerability when B12 is marginal; excess folate may heighten hematopoietic B12 demand and divert B12 from other tissues.⁷˒⁹⁴
Subtle metabolic dysregulation, even at a subclinical level, warrants careful clinical consideration, as it is often characteristic of the preclinical, asymptomatic phase of neoplastic disease, which typically spans several years.
Supplement
Harmonizing Diagnostic and Treatment Tables Supporting the 7-Point Algorithm
Thresholds are adult/general unless noted; adjust for pregnancy/CKD/HF/IBD as needed. Uncomplicated Adults (no CKD or HF)
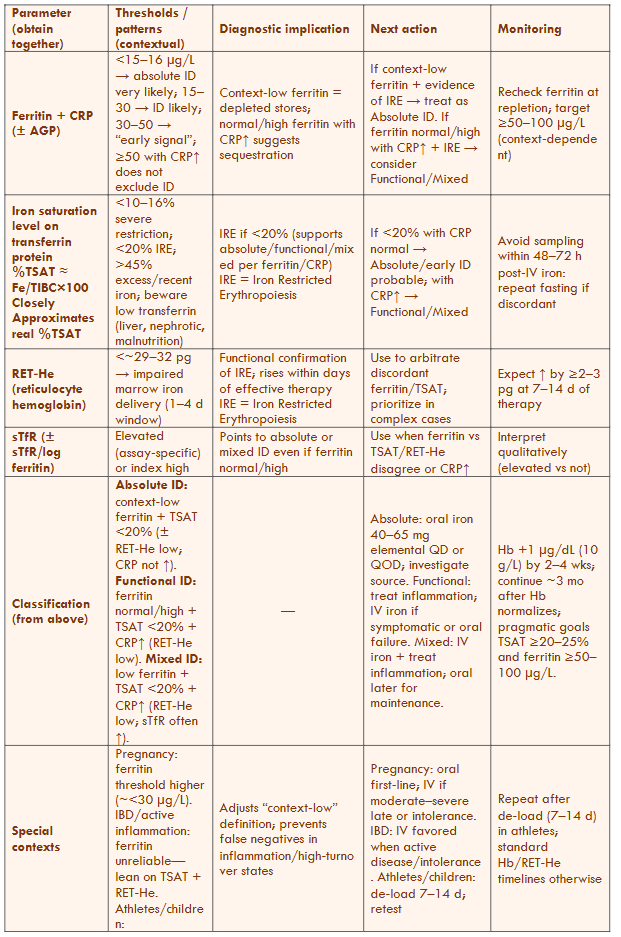
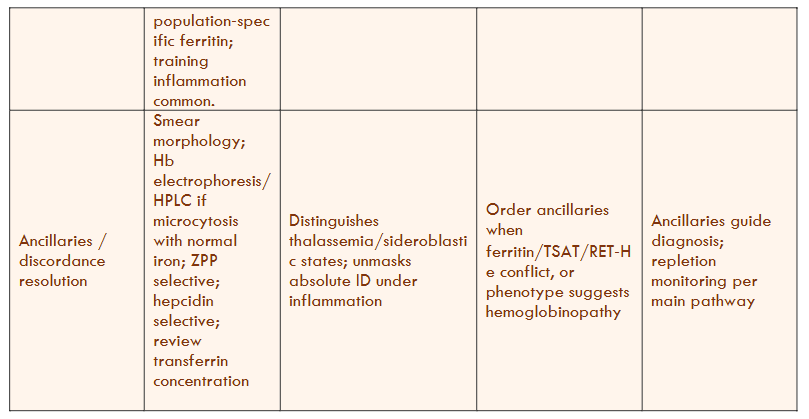
Table 7 Legend — Uncomplicated Adults (no CKD/HF)
-
Scope: Applies to ambulatory or inpatient adults without CKD or HF–specific protocols. All parameters are collected simultaneously and interpreted within their context.
-
Key cut-points: “Context-low ferritin” for most adults is approximately <30–45 µg/L; TSAT <20% indicates iron-restricted erythropoiesis (≤10–16% = severe). Avoid interpreting TSAT within 48–72 hours after IV iron or transfusion.
-
Arbitration: RET-He (29–32 pg) indicates inadequate marrow iron delivery within a 1–4-day window and serves as the earliest response marker. Use sTfR ± sTfR/log ferritin index when ferritin/TSAT/RET-He are discordant or when inflammation is present.
-
Transferrin caveat: Low transferrin levels from liver disease, nephrotic syndrome, or malnutrition can artifactually raise TSAT—focus more on measured transferrin and (RET-He/CHr).
Harmonizing Iron Studies for Heart Failure (HFrEF/HFmrEF)
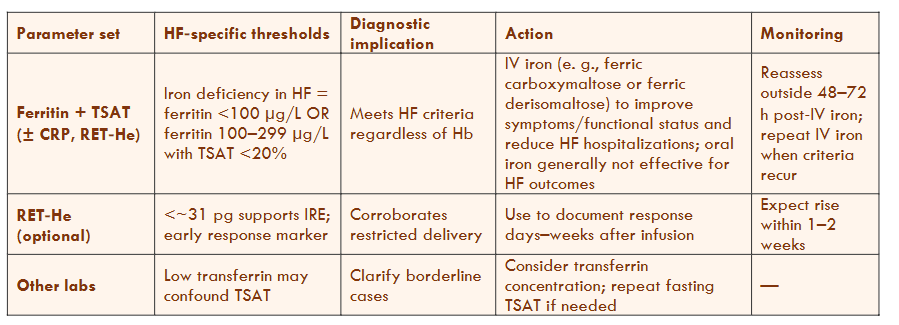
Table 8 Legend — Heart Failure (HFrEF/HFmrEF)
-
Definition of iron deficiency in HF: ferritin <100 µg/L, or ferritin 100–299 µg/L with TSAT <20%.
These criteria are independent of hemoglobin. -
Therapeutic principle: IV iron (e.g., ferric carboxymaltose or ferric derisomaltose) improves symptoms and functional status and reduces HF hospitalizations; oral iron has not shown comparable outcome benefits in HF trials.
The Well-Appearing Patient: Laboratory Identification of Pro-Neoplastic Risk in Latent Iron, Vitamin B12, and Folate Deficiency
-
Documentation: RET-He/Ret-He is optional to demonstrate physiological response within 1–2 weeks of infusion.
-
HFrEF: heart failure with reduced ejection fraction (LVEF ≤40%).
-
HFmrEF: heart failure with mildly reduced ejection fraction (LVEF 41–49%).
-
Scope: The criteria and actions in this table are intended for patients with LVEF ≤49% (not HFpEF ≥50%, unless explicitly stated). Evidence for IV iron is most substantial in HFrEF and extends to HFmrEF; data in HFpEF are limited.
-
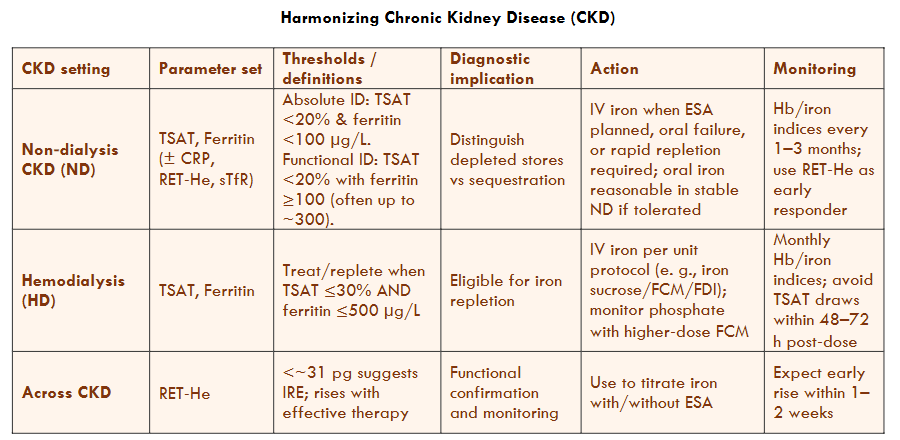
Table 9 Legend — Chronic Kidney Disease (CKD)
-
CKD-ND (non-dialysis): Absolute ID = TSAT <20% and ferritin <100 µg/L; Functional ID = TSAT <20% with higher ferritin. Consider IV iron when ESA use is planned, oral iron fails, or rapid repletion is needed.
-
CKD-HD (hemodialysis): Treat or replete when TSAT ≤30% and ferritin ≤500 µg/L; IV iron is standard protocol per unit.
-
Monitoring: Use RET-He/Ret-He as an early indicator to guide iron therapy with or without ESA; check TSAT 48–72 hours after IV doses.
-
Sampling/timing: Avoid interpreting TSAT/serum iron within 48–72 hours after IV iron or transfusion; obtain fasting when feasible.
-
Transferrin warning: Low transferrin (due to liver disease, nephrotic syndrome, or malnutrition) can make TSAT misleading; interpret it together with the measured transferrin level and RET-He or a serum transferrin by immunoassay.
Note: “RET-He (Sysmex) and CHr (Siemens) are platform-specific measures of reticulocyte hemoglobin; thresholds are not numerically interchangeable. Use laboratory-validated cut points.” Avoid interpreting TSAT within 48–72 hours after IV iron or transfusion and interpret cautiously when transferrin is low.
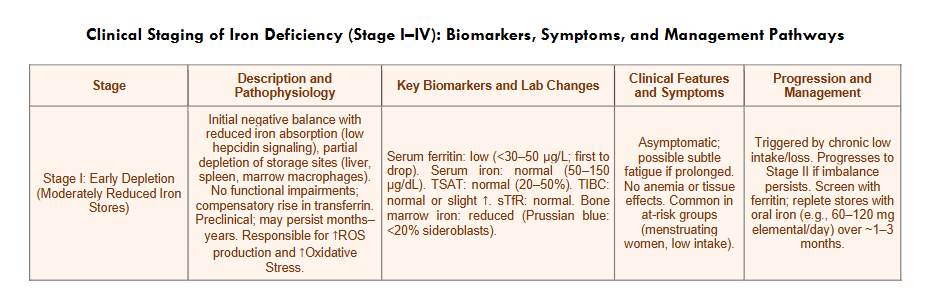
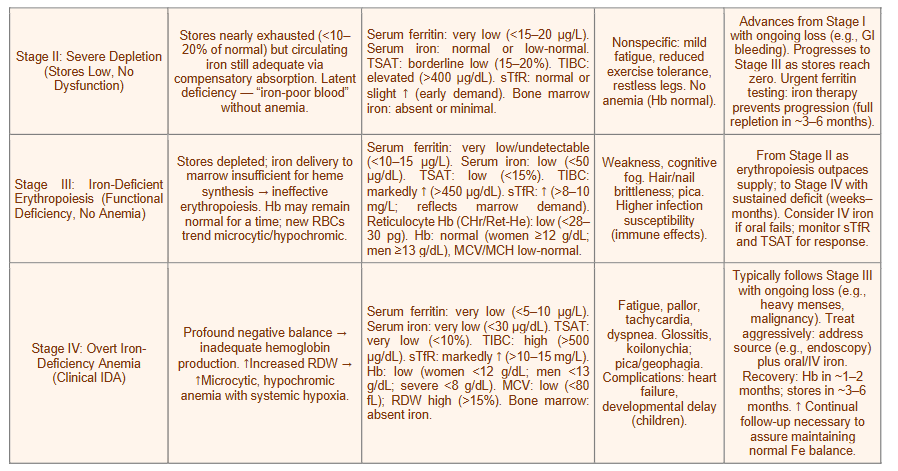
Table 10 Legend: Decision bands shown are practical clinical anchors (not assay reference intervals); verify locally. Interpret ferritin and TSAT in the context of inflammation (CRP ± AGP): inflammation tends to raise ferritin and lower TSAT. When discordant, prioritize function tests such as TSAT + Ret-He/CHr ± sTfR. Avoid interpreting TSAT/serum iron within 48–72 hours after IV iron or transfusion: check transferrin in protein-loss states. Ret-He (Sysmex) and CHr (Siemens) are similar but not numerically interchangeable, and trend on the same analyzer. sTfR increases with erythropoietic drive (e.g., ESA therapy, hemolysis, thalassemia, pregnancy). Consider sTfR/log ferritin when ferritin is confounded. Arrows indicate change direction/magnitude (↓, ↓↓).
Bibliography
- Rubio K, Hernández-Cruz EY, Rogel-Ayala DG, et al. Nutriepigenomics in Environmental-Associated Oxidative stress. Antioxidants. 2023;12(3):771. doi:10.3390/antiox12030771
- Leesang T, Lyon P, Pinzone J, Cimmino L. Micronutrient regulation of the DNA methylome. Frontiers in Epigenetics and Epigenomics. 2024;2. doi:10.3389/freae.2024.1409355
- Saha SK, Lee SB, Won J, et al. Correlation between Oxidative Stress, Nutrition, and Cancer Initiation. International Journal of Molecular Sciences. 2017;18(7):1544. doi:10.3390/ijms18071544
- Skjærven KH, Jakt LM, Fernandes JMO, et al. Parental micronutrient deficiency distorts liver DNA methylation and expression of lipid genes associated with a fatty-liver-like phenotype in offspring. Scientific Reports. 2018;8(1). doi:10.1038/s41598-018-21211-5
- Watson J, Lee M, Garcia-Casal MN. Consequences of inadequate intakes of vitamin A, vitamin B12, vitamin D, calcium, iron, and folate in older persons. Current Geriatrics Reports. 2018;7(2):103-113. doi:10.1007/s13670-018-0241-5
- Snook J, Bhala N, Beales ILP, et al. British Society of Gastroenterology guidelines for the management of iron deficiency anaemia in adults. Gut. 2021;70(11):2030-2051. doi:10.1136/gutjnl-2021-325210
- Balendran S, Forsyth C. Non-anaemic iron deficiency. Australian Prescriber. 2021;44(6):193-196. doi:10.18773/austprescr.2021.052
- Goel A, Bakshi S, Soni N, Chhavi N. Iron deficiency anemia and Plummer–Vinson syndrome: current insights. Journal of Blood Medicine. 2017;Volume 8:175-184. doi:10.2147/jbm.s127801
- Binet Q, Delorme A. Plummer–Vinson Syndrome. New England Journal of Medicine. 2024;390(7):652. doi:10.1056/nejmicm2309721
- Kowdley KV. Iron, hemochromatosis, and hepatocellular carcinoma. Gastroenterology. 2004;127(5):S79-S86. doi:10.1016/j.gastro.2004.09.019
- Kew MC. Hepatic iron overload and hepatocellular carcinoma. Liver Cancer. 2014;3(1):31-40. doi:10.1159/000343856
- Cancado RD, Leite LAC, Muñoz M. Defining global thresholds for serum ferritin: a challenging mission in establishing the iron deficiency diagnosis in this era of striving for health equity. Diagnostics. 2025;15(3):289. doi:10.3390/diagnostics15030289
- Galetti V, Stoffel NU, Sieber C, Zeder C, Moretti D, Zimmermann MB. Threshold ferritin and hepcidin concentrations indicating early iron deficiency in young women based on upregulation of iron absorption. EClinicalMedicine. 2021;39:101052. doi:10.1016/j.eclinm.2021.101052
- Moretti D, Goede JS, Zeder C, et al. Oral iron supplements increase hepcidin and decrease iron absorption from daily or twice-daily doses in iron-depleted young women. Blood. 2015;126(17):1981-1989. doi:10.1182/blood-2015-05-642223
- Tarancon-Diez L, Genebat M, Roman-Enry M, et al. Threshold Ferritin Concentrations Reflecting Early Iron Deficiency Based on Hepcidin and Soluble Transferrin Receptor Serum Levels in Patients with Absolute Iron Deficiency. Nutrients. 2022;14(22):4739. doi:10.3390/nu14224739
- Oustamanolakis P, Koutroubakis IE. Soluble transferrin receptor-ferritin index is the most efficient marker for the diagnosis of iron deficiency anemia in patients with IBD. Inflammatory Bowel Diseases. 2011;17(12):E158-E159. doi:10.1002/ibd.21881
- Phiri KS, Calis JCJ, Siyasiya A, Bates I, Brabin B, Van Hensbroek MB. New cut-off values for ferritin and soluble transferrin receptor for the assessment of iron deficiency in children in a high infection pressure area. Journal of Clinical Pathology. 2009;62(12):1103-1106. doi:10.1136/jcp.2009.066498
- Ko CW, Siddique SM, Patel A, et al. AGA Clinical Practice Guidelines on the Gastrointestinal Evaluation of iron Deficiency Anemia. Gastroenterology. 2020;159(3):1085-1094. doi:10.1053/j.gastro.2020.06.046
- Rockey DC, Altayar O, Falck-Ytter Y, Kalmaz D. AGA Technical Review on Gastrointestinal Evaluation of Iron Deficiency Anemia. Gastroenterology. 2020;159(3):1097-1119. doi:10.1053/j.gastro.2020.06.045
- Wen CP, Lee JH, Tai YP, et al. High Serum Iron Is Associated with Increased Cancer Risk. Cancer Research. 2014;74(22):6589-6597. doi:10.1158/0008-5472.can-14-0360
- Means RT, Bi C, Wong ECC, Bare LA, McPhaul MJ. Ferritin reference intervals in a population of working-age adults without anemia. American Journal of Hematology. 2024;99(10):2047-2049. doi:10.1002/ajh.27444
- Herbert V. Everyone should be tested for iron disorders. Journal of the American Dietetic Association. 1992;92(12):1502-1509. doi:10.1016/s0002-8223(21)00936-6
- Brugnara C. Schiller B, Moran J. Reticulocyte hemoglobin equivalent (Ret He) and assessment of iron-deficient states. Clinical and Laboratory Hematology. 2006;28(5):303-308. doi:10.1111/j.1365-2257.2006.00812.x
- Hanahan D. Hallmarks of Cancer: New dimensions. Cancer Discovery. 2022;12(1):31-46. doi:10.1158/2159-8290.cd-21-1059
- Mantovani A, Allavena P, Sica A, Balkwill F. Cancer-related inflammation. Nature. 2008;454(7203):436-444. doi:10.1038/nature07205
- Aksan A, Farrag K, Aksan S, Schroeder O, Stein J. Flipside of the coin: iron deficiency and colorectal cancer. Frontiers in Immunology. 2021;12. doi:10.3389/fimmu.2021.635899
- Jäger L, Rachamin Y, Senn O, Burgstaller JM, Rosemann T, Markun S. Ferritin cutoffs and diagnosis of iron deficiency in primary care. JAMA Network Open. 2024;7(8):e2425692. doi:10.1001/jamanetworkopen.2024.25692
- Bailey RL, West KP Jr, Black RE. The Epidemiology of Global Micronutrient Deficiencies. Annals of Nutrition and Metabolism. 2015;66(Suppl. 2):22-33. doi:10.1159/000371618
- Barton JC, Wiener HW, Barton JC, Acton RT. Prevalence of iron deficiency using 3 definitions among women in the US and Canada. JAMA Network Open. 2024;7(6):e2413967. doi:10.1001/jamanetworkopen.2024.13967
- Solomon LR. Cobalamin-responsive disorders in the ambulatory care setting: unreliability of cobalamin, methylmalonic acid, and homocysteine testing. Blood. 2004;105(3):978-985. doi:10.1182/blood-2004-04-1641
- Beaudry-Richard A, Abdelhak A, Saloner R, et al. Vitamin B12 Levels Association with Functional and Structural Biomarkers of Central Nervous System Injury in Older Adults. Annals of Neurology. Published online February doi:10, 2025. doi:10.1002/ana.27200
- Herbert V. The 1986 Herman award lecture. Nutrition science as a continually unfolding story: the folate and vitamin B-12 paradigm. American Journal of Clinical Nutrition. 1987;46(3):387-402. doi:10.1093/ajcn/46.3.387
- Herbert V. Staging vitamin B−12 (cobalamin) status in vegetarians. American Journal of Clinical Nutrition. 1994;59(5):1213S-1222S. doi:10.1093/ajcn/59.5.1213s
- Herbert V. Don’t ignore low serum cobalamin (Vitamin B12) levels. Archives of Internal Medicine. 1988;148(8):1705. doi:10.1001/archinte.1988.00380080009003
- Herbert V. The Megaloblastic Anemias. New York, NY: Grune & Stratton; 1959.
- Temlett JA. An assessment of vibration threshold using a biothesiometer compared to a C128-Hz tuning fork. Journal of Clinical Neuroscience. 2009;16(11):1435-1438. doi: 10.1016/j.jocn.2009.03.010
- Devalia V, Hamilton MS, Molloy AM. Guidelines for the diagnosis and treatment of cobalamin and folate disorders. British Journal of Haematology. 2014;166(4):496-513. doi:10.1111/bjh.12959
- Ames BN. DNA damage from micronutrient deficiencies is likely to be a major cause of cancer. Mutation Research/Fundamental and Molecular Mechanisms of Mutagenesis. 2001;475(1-2):7-20. doi:10.1016/s0027-5107(01)00070-7
- Shimizu J, Hamashima Y, Tsuda H, Akiyama Y, Mikawa H, Ikehara S. Case report: T‑cell acute lymphoblastic leukemia relapsing as acute myelomonocytic leukemia and terminating possibly as chronic myelocytic leukemia. American Journal of Hematology. 1987;24(2):199-205. doi:10.1002/ajh.2830240211
- Herbert V, Tisman G, Go LT, Brenner L. The dU Suppression Test using 125I‑UdR to Define Biochemical Megaloblastosis. British Journal of Haematology. 1973;24(6):713-723. doi:10.1111/j.1365-2141.1973.tb01698.x
- Galloway M. Red cell or serum folate? Results from the National Pathology Alliance benchmarking review. Journal of Clinical Pathology. 2003;56(12):924-926. doi:10.1136/jcp.56.12.924
- Reynolds EH. The risks of folic acid to the nervous system in vitamin B12 deficiency: rediscovered in the era of folic acid fortification policies. Journal of Neurology Neurosurgery & Psychiatry. 2017;88(12):1097-1098. doi:10.1136/jnnp-2017-316296
- Miller JW, Smith A, Troen AM, Mason JB, Jacques PF, Selhub J. Excess folic acid and vitamin B12 deficiency: clinical implications? Food and Nutrition Bulletin. 2024;45(1_suppl):S67-S72. doi:10.1177/03795721241229503
- Selhub J, Morris MS, Jacques PF. In vitamin B 12 deficiency, higher serum folate is associated with increased total homocysteine and methylmalonic acid concentrations. Proceedings of the National Academy of Sciences. 2007;104(50):19995-20000. doi:10.1073/pnas.0709487104
- Miller JW, Garrod MG, Allen LH, Haan MN, Green R. Metabolic evidence of vitamin B-12 deficiency, including high homocysteine and methylmalonic acid and low holotranscobalamin, is more pronounced in older adults with elevated plasma folate. American Journal of Clinical Nutrition. 2009;90(6):1586-1592. doi:10.3945/ajcn.2009.27514
- Birn H. The kidney in vitamin B12 and folate homeostasis: characterization of receptors for tubular uptake of vitamins and carrier proteins. AJP Renal Physiology. 2006;291(1):F22-F36. doi:10.1152/ajprenal.00385.2005
- Morris MS, Jacques PF, Rosenberg IH, Selhub J. Folate and vitamin B-12 status in relation to anemia, macrocytosis, and cognitive impairment in older Americans in the age of folic acid fortification. American Journal of Clinical Nutrition. 2007;85(1):193-200. doi:10.1093/ajcn/85.1.193
- Clarke R, Sherliker P, Hin H, et al. Folate and vitamin B12 status in relation to cognitive impairment and anaemia in the setting of voluntary fortification in the UK. British Journal of Nutrition. 2008;100(5):1054-1059. doi:10.1017/s0007114508958001
- Bailey RL, Jun S, Murphy L, et al. High folic acid or folate combined with low vitamin B-12 status: potential but inconsistent association with cognitive function in a nationally representative cross-sectional sample of US older adults participating in the NHANES. American Journal of Clinical Nutrition. 2020;112(6):1547-1557. doi:10.1093/ajcn/nqaa239
- Raghavan R, Riley AW, Volk H, et al. Maternal multivitamin intake, plasma folate and vitamin B12 Levels and autism spectrum disorder risk in offspring. Paediatric and Perinatal Epidemiology. 2017;32(1):100-111. doi:10.1111/ppe.12414
- Surén P, Roth C, Bresnahan M, et al. Association between maternal use of folic acid supplements and risk of autism spectrum disorders in children. JAMA. 2013;309(6):570. doi:10.1001/jama.2012.155925
- Mikael LG, Deng L, Paul L, Selhub J, Rozen R. Moderately high intake of folic acid has a negative impact on mouse embryonic development. Birth Defects Research. 2012;97(1):47-52. doi:10.1002/bdra.23092
- Zhao Y, Chen D, Tang J, Zheng Y, Qi J, Wang H. Parental folate deficiency induces birth defects in mice accompanied with increased de novo mutations. Cell Discovery. 2022;8(1). doi:10.1038/s41421-021-00364-0
- Molloy AM, Pangilinan F, Brody LC. Genetic risk factors for Folate-Responsive Neural Tube defects. Annual Review of Nutrition. 2017;37(1):269-291. doi:10.1146/annurev-nutr-071714-034235
- Lambrot R, Xu C, Saint-Phar S, et al. Low paternal dietary folate alters the mouse sperm epigenome and is associated with negative pregnancy outcomes. Nature Communications. 2013;4(1). doi:10.1038/ncomms3889
- Chan D, Ly L, Rebolledo EMD, et al. Transgenerational impact of grand-paternal lifetime exposures to both folic acid deficiency and supplementation on genome-wide DNA methylation in male germ cells. Andrology. 2023;11(5):927-942. doi:10.1111/andr.13399
- Green R. Is it time for vitamin B-12 fortification? What are the questions? American Journal of Clinical Nutrition. 2009;89(2):712S-716S. doi:10.3945/ajcn.2008.26947e
- Selhub J, Paul L. Folic acid fortification: Why not vitamin B12 also? BioFactors. 2011;37(4):269-271. doi:10.1002/biof.173
- Tisman G, Kutik S, Rainville C. Coexistence of pernicious anemia and prostate cancer – “an experiment of nature” involving vitamin B12 modulation of prostate cancer growth and metabolism: a case report. Journal of Medical Case Reports. 2009;3(1). doi:10.1186/1752-1947-3-9295
- Fedosov SN, Brito A, Miller JW, Green R, Allen LH. Combined indicator of vitamin B12 status: modification for missing biomarkers and folate status and recommendations for revised cut-points. Clinical Chemistry and Laboratory Medicine (CCLM). 2015;53(8). doi:10.1515/cclm-2014-0818
- Willmann C, Heni M, Linder K, et al. Potential effects of reduced red meat compared with increased fiber intake on glucose metabolism and liver fat content: a randomized and controlled dietary intervention study. American Journal of Clinical Nutrition. 2018;109(2):288-296. doi:10.1093/ajcn/nqy307
- Courtemanche C, Huang AC, Elson‑Schwab I, Kerry N, Ng BY, Ames BN. Folate deficiency and ionizing radiation cause DNA breaks in primary human lymphocytes: a comparison. The FASEB Journal. 2003;18(1):209-211. doi:10.1096/fj.03-0382fje
- Palmer AM, Kamynina E, Field MS, Stover PJ. Folate rescues vitamin B 12 depletion-induced inhibition of nuclear thymidylate biosynthesis and genome instability. Proceedings of the National Academy of Sciences. 2017;114(20). doi:10.1073/pnas.1619582114
- Blount BC, Mack MM, Wehr CM, et al. Folate deficiency causes uracil misincorporation into human DNA and chromosome breakage: Implications for cancer and neuronal damage. Proceedings of the National Academy of Sciences. 1997;94(7):3290-3295. doi:10.1073/pnas.94.7.3290
- Ames BN. Low micronutrient intake may accelerate the degenerative diseases of aging through allocation of scarce micronutrients by triage. Proceedings of the National Academy of Sciences. 2006;103(47):17589-17594. doi:10.1073/pnas.0608757103
- Fenech M. The role of folic acid and Vitamin B12 in genomic stability of human cells. Mutation Research/Fundamental and Molecular Mechanisms of Mutagenesis. 2001;475(1-2):57-67. doi:10.1016/s0027-5107(01)00079-3
- Rineau E, Gueguen N, Procaccio V, et al. Iron Deficiency without Anemia Decreases Physical Endurance and Mitochondrial Complex I Activity of Oxidative Skeletal Muscle in the Mouse. Nutrients. 2021;13(4):1056. doi:10.3390/nu13041056
- Leermakers PA, Remels AHV, Zonneveld MI, Rouschop KMA, Schols AMWJ, Gosker HR. Iron deficiency-induced loss of skeletal muscle mitochondrial proteins and respiratory capacity; the role of mitophagy and secretion of mitochondria-containing vesicles. The FASEB Journal. 2020;34(5):6703-6717. doi:10.1096/fj.201901815r
- Walter PB, Knutson MD, Paler-Martinez A, et al. Iron deficiency and iron excess damage mitochondria and mitochondrial DNA in rats. Proceedings of the National Academy of Sciences. 2002;99(4):2264-2269. doi:10.1073/pnas.261708798
- Zhang C. Essential functions of iron-requiring proteins in DNA replication, repair and cell cycle control. Protein & Cell. 2014;5(10):750-760. doi:10.1007/s13238-014-0083-7
- Sanvisens N, Bañó MC, Huang M, Puig S. Regulation of ribonucleotide reductase in response to iron deficiency. Molecular Cell. 2011;44(5):759-769. doi:10.1016/j.molcel.2011.09.021
- Aslan M, Horoz M, Kocyigit A, et al. Lymphocyte DNA damage and oxidative stress in patients with iron deficiency anemia. Mutation Research/Fundamental and Molecular Mechanisms of Mutagenesis. 2006;601(1-2):144-149. doi:10.1016/j.mrfmmm.2006.06.013
- Fenech M. Micronutrients and genomic stability