

Noninvasive OCT Imaging for Squamous Cell Carcinoma
The Use of Optical Coherence Tomography Imaging and Vibrational Studies to Compare Noninvasive Measurements and Histopathology: A pilot Study of Squamous Cell Carcinoma
Gayathri Kollipara1, Frederick H. Silver1,2, Tanmay Deshmukh2, and Aanal Patel1
- Gayathri Kollipara Department of Pathology and Laboratory Medicine, Robert Wood Johnson Medical School, Rutgers, the State University of New Jersey, Piscataway, NJ 08854, USA.
- Frederick H. Silver Department of Pathology and Laboratory Medicine, Robert Wood Johnson Medical School, Rutgers, the State University of New Jersey, Piscataway, NJ 08854, USA; OptoVibronex, LLC., Ben Franklin Tech Ventures, Bethlehem, PA 18105, USA.
- Tanmay Deshmukh OptoVibronex, LLC., Ben Franklin Tech Ventures, Bethlehem, PA 18105, USA.
- Aanal Patel Department of Pathology and Laboratory Medicine, Robert Wood Johnson Medical School, Rutgers, the State University of New Jersey, Piscataway, NJ 08854, USA.
OPEN ACCESS
PUBLISHED: 30 June 2025
CITATION: Kollipara, G., Silver, F.H., et al., 2025. The Use of Optical Coherence Tomography Imaging and Vibrational Studies to Compare Noninvasive Measurements and Histopathology: A pilot Study of Squamous Cell Carcinoma. Medical Research Archives, [online] 13(6). https://doi.org/10.18103/mra.v13i6.6543
DOI https://doi.org/10.18103/mra.v13i6.6543
ISSN 2375-1924
ABSTRACT
Background: Squamous cell carcinoma is a cutaneous skin lesion that is the second numerous skin cancer after basal cell carcinoma. It is more likely to metastasize to secondary sites compared to basal cell carcinomas.
Objective: To determine if noninvasive optical coherence tomography images and vibrational data can be correlated with histopathology of squamous cell carcinoma to better understand how this lesion can be determined without a biopsy.
Methods: We have used vibrational optical coherence tomography and histopathology to determine if optical coherence tomography subchannel images and noninvasive measurements can be correlated with lesion histopathology. Optical tomography images were collected on cancer excisions before they were sent for standard diagnosis by a dermatopathologist. The gray scale optical coherence tomography images were broken down into green (low pixel intensity), blue (medium intensity), and red (high intensity) subchannels images and scanned to create pixel intensity versus depth plots. Quantitative mechanovibrational spectra and optical coherence tomography images during vibration with sound frequencies between 50 and 80 Hz were also collected.
Results: Our results indicate that green subchannel maximum pixel intensities representing the cellular content of squamous cell carcinomas are lower than those of normal skin and appear to decrease as the lesion size of keratinous accumulations increase. In addition, the blue subchannel which provides information on collagen appears to change as the size and amount of the lesions increases. This is due to the forward scattering (Mie scattering) of the infrared light deeper into the sample by the large cellular and keratin accumulations present.
Conclusion: The height and width of the pixel intensity versus depth plots can be used to characterize the type of lesion and its relative size. In addition, when the sample is vibrated at or near the resonant frequency of the cancer associated fibroblasts (CAFs) and keratinocytes the lesion almost vanishes in the green, blue, and red subchannels channels. These results suggest that vibrational coherence tomography can be used in telemedicine to classify lesions in areas where Dermatologist visits are difficult to schedule.
Keywords
VOCT, OCT, squamous cell cancer, imaging, resonant frequency, elastic modulus, RGB subchannel images
THE EUROPEAN SOCIETY OF MEDICINE
Medical Research Archives, Volume 13 Issue 6
RESEARCH ARTICLE
Introduction
Approximately 5.4 M BCCs and squamous cell cancers (SCCs) are diagnosed in the US each year; about 8 out of 10 of these cancers are BCCs, of which 60-80% are reported to be the nodular type. The remaining skin cancers are SCCs. Diagnostic evaluation of skin cancer is done primarily by visual inspection and dermoscopy. Dermoscopy is the most widely used method to detect skin cancers since they are characterized by several morphological characteristics. BCCs typically present clinically as pearly, shiny, smooth nodules with small dilated, branched blood vessels that can ulcerate or bleed. Dermoscopic diagnostic criteria for pigmented BCCs have been well documented. While dermoscopic diagnostic criteria are quite diverse, based on recent VOCT studies the physical properties of different types of BCCs are similar. Characteristics of SCC include white circles, white structureless areas, keratin pearls, and a polymorphous vascular pattern.
Nonmelanoma skin cancer (NMSC) is the most common form of skin cancer in the Caucasian population, with squamous cell carcinoma (SCC) accounting for the majority of NMSC metastases and deaths. It is believed that actinic keratosis (AK) a UV-induced lesion in the skin can eventually transform into a cancerous lesion termed squamous cell cancer (SCC). AK and SCC have a similar genetic profile, including alterations in the p53 gene. The estimated annual risk of progression from AK to SCC is small; however, the cumulative risk for a patient with multiple AK lesions over time is substantial. Squamous cell carcinoma (SCC), has one of the highest incidences of all cancers in the United States, is an age-dependent disease primarily on patients over 70 years of age. Recent evidence suggests that dermal wounding therapies can decrease the proportion of senescent dermal fibroblasts, increase dermal IGF-1 expression, thus protecting geriatric keratinocytes from UVB-induced SCC initiation. Tobacco smoke and alcohol drinking are major risk factors for squamous cell carcinoma of the head and neck. The mean level of apoptotic capacity in the SCC cases was reported to be significantly lower than that in the control patients who did not smoke or drink alcohol.
Ultraviolet-induced P53 mutations are early events in cancer stroma cells (CSCs), and are responsible for great genomic instability. Other genetic changes occur in CDKN2A and NOTCH and in oncogenes, such as RAS. Mouse models of squamous cell carcinoma (SCC) have demonstrated that tumor cells responding to transforming growth factor β (TGF-β) function as drug-resistant cancer stem cells (CSCs). The gene expression of TGF-β–responding tumor cells has accelerated the identification of the pathways that CSCs drive invasive tumor progression. DEK, a conserved nuclear factor, has been reported to play important roles in the progression of early and late-stage SCC.
Histologically, typical SCC is characterized by nests of squamous epithelial cells arising from the epidermis and extending into the dermis. The malignant cells are often large with abundant eosinophilic material when stained with H&E. Keratin pearls form when malignant epithelial cells, which have lost their cohesion, become arranged concentrically, and then undergo keratinization.
In this pilot study we compare SCC histopathology of two patient cases with noninvasive data obtained using OCT and vibrational analysis to correlate data determined noninvasively with histopathology.
Methods
OCT Image Collection
The Vibrational OptoScope used in this study consisted of a Lumedica OQ 2.0 OCT (Lumedica Inc, Durham, NC) equipped with a small 2.0 inch speaker as described previously operating at a wavelength of 840 nm collecting 13,000 frames per second. The measurements were made in vivo on intact control skin and in vitro and on excised SCC biopsies. All images were made as part of IRB approved clinical studies on skin at Rutgers Center for Dermatology as discussed previously. Clinical diagnoses were made by a board certified dermatopathologist after H&E staining and review of the tissue sections as part of routine clinical skin excisional protocols. Raw image OCT data were collected and processed using MATLAB software and image J. All OCT images were created by scanning the skin or SCC cross section. The gray scale scans were color coded using image j as reported previously. Pixel intensity versus depth plots were generated by scanning the gray scale OCT images parallel to the surface of the samples.
VOCT Measurements
The OQ Labscope 2.0 was modified by adding a 2 inch-diameter speaker placed about 2.0 inches from the tissue to be vibrated in the VOCT studies. A sinusoidal sound wave at 55 dB was produced using an app supplied by the I5 computer that is part of the Labscope. Both the sound wave and the light were applied to the surface along the axis of the light beam. The deflection of the surface along the direction of the light beam was measured. All weighted displacement measurements were made from line data at a single point based on the location of the lesion using the OCT lesion image. The Labscope was modified to collect and store single raw image data that were used to calculate sample displacements (amplitude information) from A line data. The data were processed using MATLAB software, as discussed previously. The displacement of the tissue in phase with the sound was detected by measuring the frequency dependence of the tissue deformation based on the reflected infrared light. The reflected light was filtered to collect only vibrations that were in-phase (elastic component) with the sound input signal. The amplitude of the displacement was plotted against the frequency of the vibrations. The result is a spectrum of displacements (mechanovibrational spectrum) for specific tissue components as a function of the frequency of the applied sound; the resonant frequency of each tissue component, e.g., cells (50–80 Hz), dermal collagen (100–120 Hz), blood vessels (130–150 Hz), and fibrotic tissue (180–260 Hz), have been assigned previously based on studies on a variety of soft tissues.
Results
In this study we collected OCT images and histopathology on a small SCC and a large SCC to determine if OCT and histological images could be correlated.
The OCT images can be scanned to give quantitative data on the pixel intensities as a function of depth to provide details concerning the location of cells, keratin, and collagen in the OCT images.
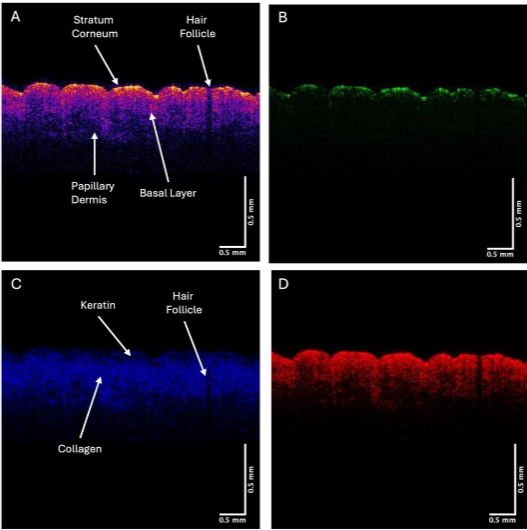
Typical plots of pixel intensity versus depth for normal skin (A), the green (B), blue (C), and red (D) subchannels are shown in Figure 3. The green subchannel (B) contributes to the image at a depth of the stratum corneum, the blue channel (C) contributes maximally to the germinating and papillary layers, and the red channel (D) is seen throughout the depth of the skin but does not appear to show the stratum corneum.
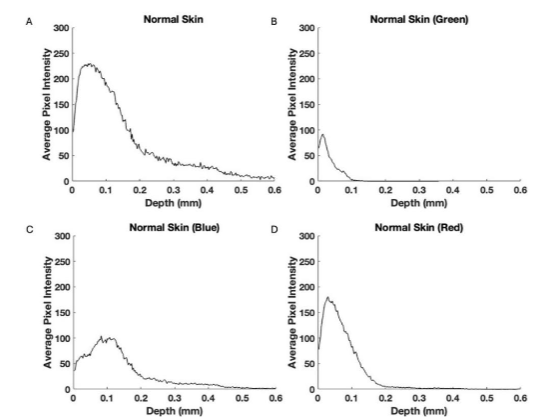
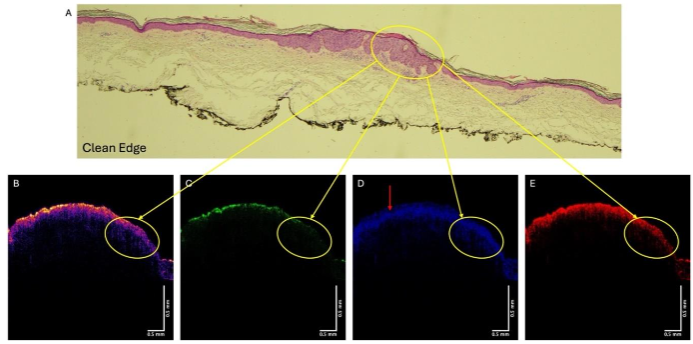
Figure 4A shows the histopathology of a lesion diagnosed as SCC by a dermatopathologist. The color-coded OCT images are shown in Figures B, while the green (C), blue (D), and red (E) subchannels are also shown. One of the cancerous lesions is circled in Figures 4A, B, C and D. Note the area where the lesion is found in 4A shows reduced reflection in the green channel (4B) as well as a loss of the hyporeflective region (4D). The red arrow points to the hyporeflective region in 4D that is missing in the area where the lesion is.
When the sample is vibrated at frequencies between 50 and 80 Hz the image changes in its intensity.
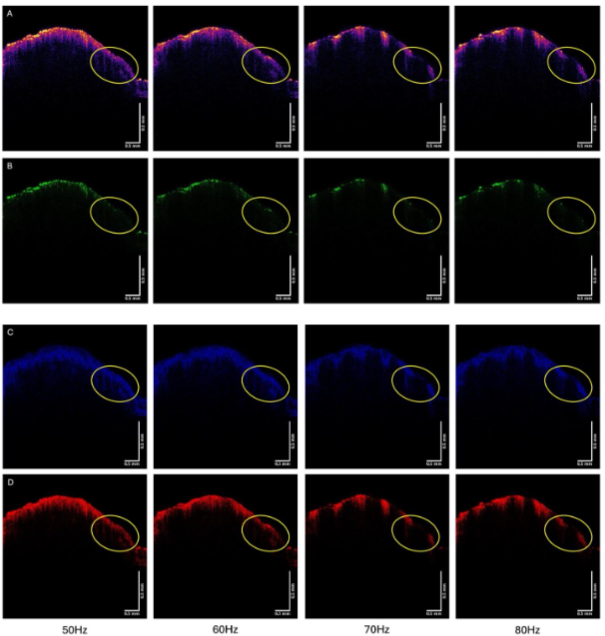
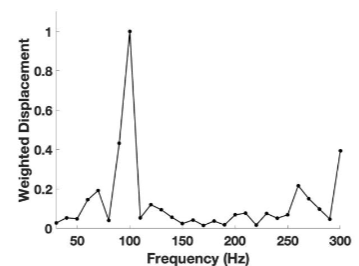
Figure 6 shows that the average pixel intensity versus depth plot (left) obtained by scanning the SCC from patient 29 parallel to the surface and the weighted displacement versus frequency (right) generated by vibrating the sample between frequencies of 30 and 300 Hz. Normal skin has resonant frequency peaks at 50 Hz (cells), 100 Hz (dermal collagen), and 150 Hz (blood vessels). Cancerous lesions have new peaks at about 80 Hz (cancer associated fibroblasts (CAFs) and keratinocytes), 130 Hz (new thin blood vessels), and 250-260 Hz (fibrotic tissue).
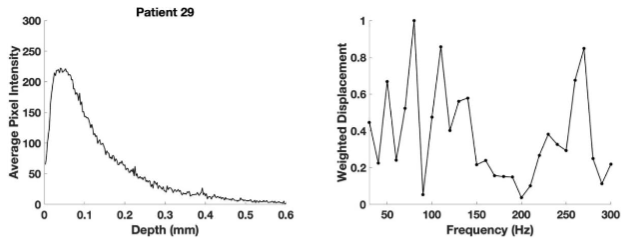
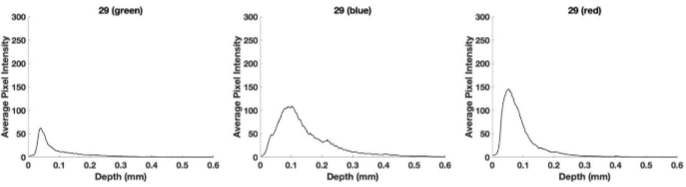
Figure 7 shows plots of pixel intensity versus depth for the SCC from patient 29. The green subchannel maximum height previously reported for normal skin is about 100 compared to a value of about 65 for the SCC from patient 29 shown in Figure 7. The blue subchannel width reported previously for normal skin is generally shifted to the right in SCC. The red subchannel for the SCC seen in Figure 7 is also shifted to the right compared to that reported for normal skin as shown in Figure 3.
In comparison to the small lesion, Figure 8 shows histopathology and OCT images for a large SCC from patient 23. The lesion circled in the histopathology (8A) is also circled in the color-coded OCT (Figure 8B) and the images of the green (8C), blue (8D), and red (8E) subchannels. Note there are other lesions that are not circled in the histopathology that are found in Figure 8 to avoid confusion.
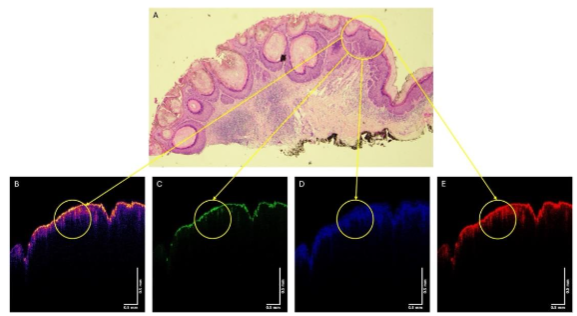
Figure 9 shows the color-coded OCT image of the SCC from patient 23 (A), and the green (B), blue (C), and red (D) subchannel images during vibration at 50, 60, 70, and 80 Hz. Note the lesion seen in Figure 8A is circled in the images in Figure 9. Note the lesion circled in Figure 9 partially disappears when vibrated at 70 and 80 Hz, especially in the green channel. Other lesions seen in Figure 9A also disappear when vibrated at 70 and 80 Hz.
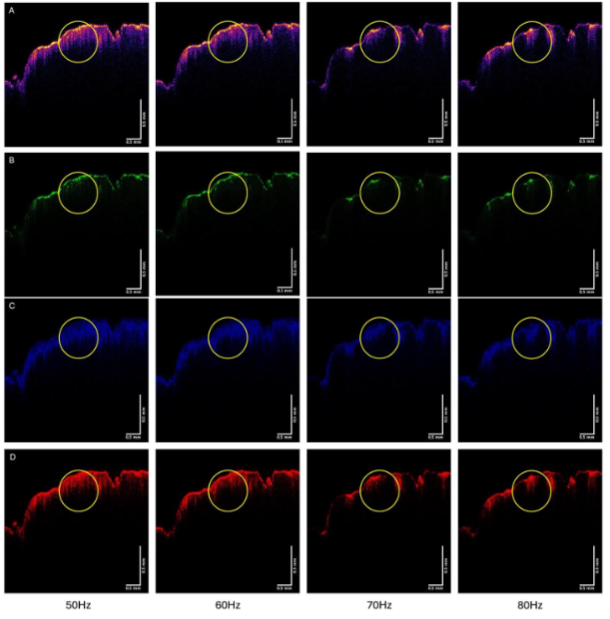
Figure 10 shows a plot of pixel intensity versus depth (left) and a plot of weighted displacement versus frequency (right) for the SCC from patient 23. Note the pixel intensity versus depth plot is somewhat broader than that for patient 29 compared to that for patient 29. The weighted displacement versus frequency plot for patient 23 shows a large peak at 80 Hz and a smaller one at 250-260 Hz compared to that for patient 29.
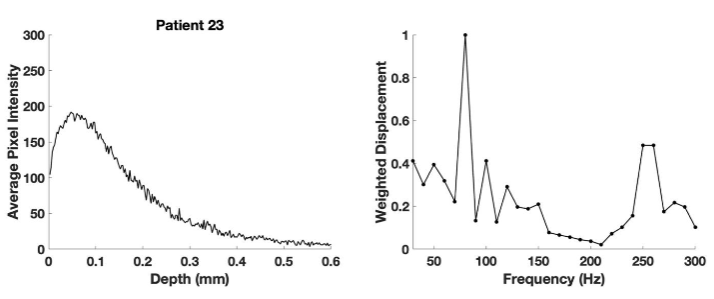
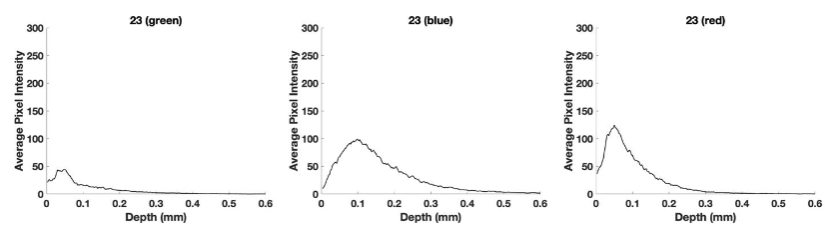
Figure 11 shows plots of pixel intensity versus depth for the SCC from patient 23 and weighted displacement versus depth (right) for the color-coded and subchannel images. Note the green subchannel pixel maximum height is about 45 which is lower than that for patient 29 and that for normal skin. The lower green channel height is likely due to forward scattering by the large keratin deposits seen in the histopathology image of patient 23 due to elastic scattering (Mie scattering).
Discussion
Differentiation of normal skin from benign lesions and cancerous tissue has been a major diagnostic challenge as the number of skin cancers continues to increase worldwide. Yet, rapid early diagnosis of small lesions is important to provide a wider array of treatment options. Excisional versus topical treatments have become important issues especially for keratinocyte cancers. Depending on their size, shape, and rate of recurrence there may be different treatment options. While identification of suspicious lesions can be achieved based on visual and dermoscopic analysis, identification of lesion subtype can be further refined based on other imaging methods including ultrasound and vibrational optical coherence tomography, based on their size and shape. Skin malignancies are the most common type of cancer diagnosed in the United States (US) and the number of Dermatologist visits are increasing each year. The clinical diagnosis of SCC remains a challenge for most primary care physicians (PCPs), to whom initial presentations usually occur.
Recently, the use of an elastic scattering device was approved by the FDA to be used by primary care physicians (PCPs) to improve diagnostic and management sensitivity by correctly classifying most benign lesions of patient concern. This may increase skin cancer detection while improving access to specialist care.
Conclusions
We have compared OCT images and histopathology of 2 SCCs. OCT images collected noninvasively provide information on the size and reflective properties of these lesions. Green subchannel maximum pixel intensities of SCCs are lower than those of normal skin and may decrease as the lesion size and amounts of keratinous aggregates increase. In addition, the blue subchannel appears to change as the size and amount of the lesions increases. This is due to the forward scattering (Mie scattering) of the infrared light deeper into the sample by the large cellular and keratin particles present. The height and width of the pixel intensity versus depth plot can be used to characterize the type of lesion and its relative size. In addition, when the sample is vibrated at or near the resonant frequency of the CAFs and keratinocytes (70 and 80 Hz) the lesion almost vanishes in the green, blue, and red subchannels. This provides a mode by which more than one part of the lesion can be viewed at the same time when there are multiple cancerous parts.
The use of VOCT to screen patients noninvasively requires only a technician to focus the image on the patient. This will allow skin screening by telemedicine in remote areas where Dermatologists are in short supply. It can be used by general practitioners to screen patients.
Conflict of Interest Statement:
None.
Funding Statement:
None.
Acknowledgements:
None.
References:
- Yanofsky VR, Mercer SE, Phelps RG. Histopathological variants of cutaneous squamous cell carcinoma: a review. J Skin Cancer. 2011;210813. doi: 10.1155/2011/210813.
- Fernandez Figueras MT. From actinic keratosis to squamous cell carcinoma: pathophysiology revisited JEADV 2017; 31 (Suppl. 2): 5–7. DOI: 10.1111/jdv.14151
- Travers JB, Spandau DF, Lewis DA, Machado C, Kingsley M, Mousdicas N, Somani AK. Fibroblast senescence and squamous cell carcinoma: how wounding therapies could be protective. Dermatol Surg. 2013;39(7):967-73. doi: 10.1111/dsu.12138.
- Liu Z, Liu H, Han P, Gao F, Dahlstrom KR, Li G, et al. Apoptotic Capacity and Risk of Squamous Cell Carcinoma of the Head and Neck. Eur J Cancer. 2017; 72: 166–176. doi:10.1016/j.ejca.2016.11.018.
- Corchado-Cobos R, García-Sancha N, González-Sarmiento R, Pérez-Losada J, Cañueto J. Cutaneous Squamous Cell Carcinoma: From Biology to Therapy. Int J Mol Sci. 2020;21(8):2956. doi: 10.3390/ijms21082956.
- Sgouros D, Theofili M, Damaskou V, Theotokoglou S, Theodoropoulos K, Stratigos A, Theofilis P, Panayiotides I, Rigopoulos D, Katoulis A. Dermoscopy as a Tool in Differentiating Cutaneous Squamous Cell Carcinoma From Its Variants. Dermatol Pract Concept. 2021;11(2):e2021050. doi: 10.5826/dpc.1102a50.
- Oshimori N. Cancer stem cells and their niche in the progression of squamous cell carcinoma. Cancer Sci. 2020;111(11):3985-3992. doi: 10.1111/cas.14639.
- Ishida K, Nakashima T, Shibata T, Hara A, Tomita H. Role of the DEK oncogene in the development of squamous cell carcinoma. Int J Clin Oncol. 2020;25(9):1563-1569. doi: 10.1007/s10147-020-01735-5.
- Silver, F.H.; Deshmukh, T.; Patel, A.; Dhillon, J.; Bobra, A.; Nadiminti, H.; British Journal of Cancer Research. 2025, 8(1), 747- 755. doi: 10.31488/bjcr.2025.
- Silver, F.H.; Deshmukh, T.; Patel, A.; Nadaminti, H. Use of Optical Coherence Tomography Images to Differentiate Between Normal Skin, Skin Lesions, and Melanoma: A Pilot Study. Journal of Cancer Science and Therapy. 2024;16:06.
- Silver, F.H.; Deshmukh, T.; Ryan, N.; Romm, A.; Nadiminti, H. “Fingerprinting” Benign and Cancerous Skin Lesions Using Vibrational Optical Coherence Tomography: Differentiation among Cancerous Lesion Types Based on the Presence of New Cells, Blood Vessels, and Fibrosis. Biomolecules 2022;12:1332.doi.org/10.3390/biom12101332.
- Shaw FM, Weinstock MA. Comparing Topical Treatments for Basal Cell Carcinoma. J Invest Dermatol 2018;138(3):484–486. doi:10.1016/jid.2017.11.024.
- Neugebauer R, Su KA, Zhu Z, Sokil M, Chren MM, Friedman GD, et al. Comparative effectiveness of treatment of actinic keratosis with topical fluorouracil and imiquimod in the prevention of keratinocyte carcinoma: A cohort study. J Am Acad Dermatol 2019;80(4):998–1005.doi:10.1016/j.jaad.2018.11.024.
- Halip IA, Vâţă D, Statescu L, Salahoru P, Patraşcu AI, Temelie OliniciD, et al. Assessment of Basal Cell Carcinoma Using Dermoscopy and High Frequency Ultrasound Examination. Diagnostics (Basel);12(3):735. doi:10.3390/diagnostics12030735.
- Tepedino M, Baltazar D, Hanna K, Bridges A, Billot L, Zeitouni NC. Elastic Scattering Spectroscopy on Patient-Selected Lesions Concerning for Skin Cancer. The Journal of the American Board of Family Medicine 2024; 37 (3): 427-435; doi: https://doi.org/10.3122/jabfm.2023.230256R2.
- Jaklitsch E, Thames T, de Campos Silva T, Coll P, Oliviero M, Ferris LK. Clinical Utility of an AI-powered, Handheld Elastic Scattering Spectroscopy Device on the Diagnosis and Management of Skin Cancer by Primary Care Physicians. J Prim Care Community Health. 2023;14:21501319231205979. doi: 10.1177/21501319231205979.
- Manolakos D, Patrick G, Geisse JK, Rabinovitz H, Buchanan K, Hoang P, et al. Use of an elastic-scattering spectroscopy and artificial intelligence device in the assessment of lesions suggestive of skin cancer: A comparative effectiveness study JAAD International 2024;14:52-58.