

TyG Index and Hypertension in Perimenopausal Women
TyG Index in Predicting Arterial Hypertension in Normoglycemic Perimenopausal Women
L.A. Ruyatkina1, D.S. Ruyatkin1, L.V. Shcherbakova2
- Federal State Budgetary Educational Institution of Higher Education «Novosibirsk State Medical University» of the Ministry of Health of the Russian Federation, Novosibirsk, Russia
- Institute of Internal and Preventive Medicine – a branch of the Institute of Cytology and Genetics, Siberian Branch of the Russian Academy of Sciences, Novosibirsk, Russia
OPEN ACCESS
PUBLISHED: 30 September 2025
CITATION: Ruyatkina, LA., Ruyatkin, DS., et al., 2025. TyG Index in Predicting Arterial Hypertension in Normoglycemic Perimenopausal Women. Medical Research Archives, [online] 13(9). https://doi.org/10.18103/mra.v13i9.6879
COPYRIGHT: © 2025 European Society of Medicine. This is an open-access article distributed under the terms of the Creative Commons Attribution License, which permits unrestricted use, distribution, and reproduction in any medium, provided the original author and source are credited.
DOI https://doi.org/10.18103/mra.v13i9.6879
ISSN 2375-1924
ABSTRACT
Introduction. The critical role of insulin resistance (IR) in the clustering of metabolic syndrome (MetS) in association with hormonal and metabolic parameters of perimenopause determines the need to search for informative IR biomarkers in the prognosis of arterial hypertension for early prevention of cardiometabolic diseases.
Objective: to evaluate the informativeness of the surrogate marker of insulin resistance, TyG index, in predicting hypertension based on the analysis of a perimenopausal normoglycemic cohort.
Patients and methods. Of 88 normoglycemic women aged 35–59 years, 58 women had hypertension and 30 were normotensive. The following were determined: waist circumference (WC), blood pressure, triglycerides (TG), HDL-C, insulin, follicle-stimulating hormone (FSH) and estradiol, fasting glucose, TyG index. Using SPSS (version 23), we estimated the median and (25%; 75%); intergroup differences using the Mann-Whitney test; comparison of proportions using Pearson’s χ2; performed correlation analyses: Spearman’s (R) and partial correlation (Rрс) to level out the influence of age; binary logistic regression was used to identify prognostic factors. ROC analysis was used to determine the cutoff point of the TYG indicator.
Results. The TyG index statistically significantly correlated with the spectrum of MetS and perimenopause parameters, most closely and stably with partial correlation with insulin, WC, HDL-C, duration of postmenopause, age depending on FSH. Using multiple logistic regression analysis, the following parameters were included in the model: age, insulin, WC, FSH, TyG; the TyG index statistically most significantly associated with the presence of hypertension (OR=22.089; p=0.007). Using ROC analysis, the cutoff point for TYG was determined – 8.7 conventional units with the optimal parameters of the diagnostic test (presence and absence of hypertension): AUC was 0.793 (95% CI: 0.694-0.892), p<0.0001; Se 74%, Sp 67%.
Conclusion. The surrogate indicator of insulin resistance, the TyG index, closely correlated with markers of MetS and perimenopause, being most significantly associated with the presence of hypertension. The cutoff point for TYG was 8.7 conventional units with optimal test parameters. The results of the partial correlation and the presence of age and FSH indices in the diagnostic model reflect a combination of chronological and reproductive aging in the dynamics of the menopausal transition.
Keywords: hypertension, metabolic syndrome, perimenopause, insulin resistance, TyG index, follicle-stimulating hormone.
Introduction
Perimenopause or the menopausal transition (MT) period includes dynamic changes in a woman’s reproductive life with significant hormonal, metabolic and cardiovascular changes. A significant increase in cardiometabolic risk (CMR) in postmenopause draws special attention to its components: hypertension, type 2 diabetes mellitus (T2DM), abdominal obesity, dyslipidemia with their close relationship within the menopausal metabolic syndrome (MetS). In contrast to the opinion of society, where menopause was considered a normal part of the aging process, there is increasing evidence that MT is a risk factor for cardiovascular diseases (CVD), regardless of age-related changes, especially considering that the earlier the menopause, the higher the CMR. On the one hand, perimenopause is a chaotic period associated with an increase in symptoms (hot flashes, anxiety, sleep disturbances), on the other hand – cardiovascular risk (CVR) factors due to changes in hormonal levels; these quality of life factors, like CVR risk factors, also change with age. In fact, perimenopause is a natural part of reproductive aging. Separation of the contribution of chronological and reproductive aging to CVR is actively debated. Longitudinal studies of women going through menopause reflect the importance of midlife as a period of accelerated growth of CVR risk.
Postmenopause is an aging process and an important period equivalent to one third of a woman’s life. Menopause significantly increases the risk of cardiometabolic diseases (CMD), which include T2DM and CVD in close association with MetS and are the main cause of morbidity and mortality. MetS itself is a platform of risk factors for CVD: hypertension, insulin resistance (IR), proatherogenic dyslipidemia, abdominal obesity and dysglycemia associated with the development and progression of CVD, chronic kidney disease and type 2 diabetes, combining them into a common pathology. In women, MetS is prognostically more significant for CVD due to the greater influence of the components of the syndrome compared to men. Despite the accumulation of knowledge about the pathophysiological differences between the sexes in the prevalence of MetS components and the associated CMR, sex differences have been poorly studied, and women are underrepresented in clinical studies.
There are sex (biological characteristic) and gender (social construct) differences that influence the pathophysiology of MetS, epidemiology and clinical management of hypertension. Individual components of MetS are the same in women and men, but how and when these components manifest themselves is important. Specific patterns are observed in women during premenopause and postmenopause. That is, men and women experience different trajectories of CMR throughout life. The presence of a unique additional risk factor for women, menopause, determines the menopausal phenotype of MetS. Its formation has its own trajectory, closely associated with changes in the functional state of the pituitary-ovarian axis: from premenopause to menopause and postmenopause. Premenopause can occur 5-10 years before menopause, the physiological age range of which is defined as 45-55 years with an average age of 51.3 years, while the CVR increases significantly at the typical age of menopause (~51 years).
Menopause is a potential risk factor for the development of IR regardless of age. A number of cardiometabolic perimenopausal changes do not depend on chronological aging and are largely due to reproductive aging, drawing attention to the relationship between CMR and hormonal changes in the pituitary-ovarian axis during perimenopause. The main factor determining increased CMR in menopausal women was considered to be a decrease in estradiol (E2). Insulin resistance and associated metabolic disorders: dyslipidemia, weight gain (assessed by body mass index, BMI, and waist circumference, WC) and decreased glucose tolerance tend to increase sharply with the onset of menopause. Changes in the functional state of the pituitary-ovarian axis with hormonal fluctuations affecting insulin sensitivity are observed already in premenopause, along with the transformation of closely related metabolic and hemodynamic parameters, which also start in this period. Of the components of MetS, hypertension is the leading risk factor for CVD and mortality, and the most modifiable. Its prevalence greatly affects postmenopausal women; control indicators remain suboptimal, accounting for almost 50% among middle-aged women. Importantly, postmenopausal women with hypertension experience higher CVR at lower blood pressure (BP) thresholds. With an average duration of 2–8 years before the last menstrual period, MT is associated with increased clinical and subclinical CVR, including functional and structural indices of subclinical atherosclerosis.
Dysglycemia makes a significant contribution in this direction. Prediabetes is already associated with a significant risk, presence and progression of CVD, while the prevalence of T2DM in postmenopause was most strongly associated with BP levels, and insulin resistance is the central link in pathogenesis. There is no doubt that IR is a complex and multifaceted syndrome that increases the risk of CVD and can affect BP homeostasis.
To assess IR, surrogate indicators significantly associated with CVD and diabetes have been developed: the triglyceride-glucose index (TyG), the HOMA-IR index and others. The TyG index is a simple, cost-effective and reliable indicator of IR. Its potential and reliability as a prognostic biomarker of all components of the CMD and components of the MetS have been demonstrated. The superiority of the TyG indexes over HOMA-IR in predicting hypertension has been shown, with the influence of demographic characteristics: age, gender, and race. The difference in the prognostic value of IR indicators depending on gender, confirmed by the analysis of NHANES data on TyG among adults of different genders and ethnic groups and the long-term prospective TLGS study, determines the need to study proxy indicators of IR in various cohorts of individuals.
A pronounced correlation of the TyG index with the likelihood of developing hypertension in normoglycemic patients has been revealed, but only in rare cases was stratification by gender carried out, or cohorts of postmenopausal women were studied. We were unable to find publications on the prognostic role of TyG in relation to hypertension in perimenopausal women depending on hormonal status.
Objective: to evaluate the informativeness of the surrogate marker of insulin resistance, the TyG index, in predicting arterial hypertension in normoglycemic perimenopausal women.
Patients and Methods
A single-center cross-sectional cohort study conducted as part of a preventive outpatient examination of the population of a large city in Western Siberia (2005-2006) included 88 Caucasian women aged 35-59 years: 30 were normotensive, 58 had hypertension. Exclusion criteria: carbohydrate metabolism disorders and other endocrine diseases; previously diagnosed coronary heart disease, chronic heart failure; history of acute cardiovascular complications; rhythm and conduction disorders; menopausal hormone therapy; smoking; concomitant diseases in the acute stage.
Group 1 included 30 conditionally healthy women without hypertension, aged 43.00 (40.00; 46.25) years, without family history of CVD and dysglycemia. Group 2 included 58 women, aged 50.00 (43.75; 53.00) years, with a hypertension duration of 3.21 (1.00; 5.00) without regular antihypertensive therapy and a family history of CVD of 75%. Patients with hypertension did not receive any other therapy except antihypertensive therapy. Homogeneity of the groups was achieved by the following inclusion/exclusion criteria; age differences in the groups were leveled using partial correlation (correlation analysis) and by introducing age as an independent variable into the logistic regression model.
The examined women had different functional states of the ovaries: 43% were postmenopausal, the duration of postmenopause (DPM) was 1.64 (0.00; 2.00) years; in group 1, menopause was recorded in 6 (20.0%) women, in group 2 – in 32 (55.2%); some women were in perimenopause, including late premenopause and early postmenopause, which is characterized by an increase in FSH levels > 25 mU / l.
The following MetS markers were determined: WC, BMI, blood pressure levels, systolic (SBP) and diastolic (DBP); fasting glycemia (FG) values were estimated twice by the glucose oxidase method, the average values were included in the analysis; HDL-C and triglycerides (TG) were determined by the enzymatic calorimetric method. Insulin (INS), follicle-stimulating hormone (FSH) and estradiol (E2) levels were measured by enzyme immunoassay on an IMMULITE 2000XPi analyzer. The TyG index was calculated using the formula: TyG index = Ln [TG (mg/dL) x FG (mg/dL) / 2], the HOMA2-IR and HOMA2-B indices were determined using the HOMA2 calculator.
Statistical processing of the data was performed using SPSS software (version 23). The data were presented as median (Me) (25th; 75th percentiles) and compared using Mann-Whitney (two groups’ comparisons) tests. Possible correlation between hypertension risk score and parameters were tested with Spearman’s non-parametric correlation analysis and results were given as correlation coefficient (ρ). Partial correlation was used to level out the influence of age.
A receiver operating characteristic (ROC) curve analysis was applied to determine the cutoff point of the TYG indicator that could identify risk hypertension to determine the area under the curve (AUC), sensitivity (Se) and specificity (Sp). Area under curve higher than 0.75 was considered as a good discrimination. The associations between presence hypertension and clinical parameters were evaluated by logistic regression analysis, adjusted age. Two-tailed p<0.05 was used as the criterion for a statistically significant differences and correlations. The statistical analysis was partially carried out within the framework of the budget topic FWNR-2024-0002.
The study was carried out in compliance with the ethical principles for conducting scientific medical research involving human subjects, as set out in the Declaration of Helsinki of the World Medical Association.
Results
A comparative analysis of two groups of women (Table 1), divided based on the history of hypertension and the fact of taking antihypertensive drugs, reflects statistically significant differences in most parameters. Women in group 2 were older, in addition to the BP levels that marked the group, they had higher WC, BMI, TG, FG and lower HDL-C. At the same time, anthropometric and lipid characteristics in group 1 did not fully fit into the reference limits. Glycemic levels in both groups were within the reference range, although in group 2 they were higher (p=0.011), unlike women without hypertension. Insulin levels, IR indices, HOMA2-IR, and non-insulin TyG, also in the presence of hypertension, exceeded the corresponding ones in normotensive women (Table 1).
| Parameter | Group 1 n = 30 | Group 2 n = 58 | * – р 1-2 |
|---|---|---|---|
| Age, years | 43,00 (40,00; 46,25) | 50,00 (43,75; 53,00) | 0,001 |
| WC, сm | 76,50 (70,25; 83,25) | 89,50 (79,00; 99,00) | <0,001 |
| BMI, kg/m2 | 25,30 (22,42; 27,39) | 30,60 (26,33; 34,30) | <0,001 |
| SBP, mm Hg | 120,00 (120,00; 130,00) | 142,50 (130,00; 160,00) | <0,001 |
| DBP, mm Hg | 80,00 (70,00; 80,00) | 90,00 (80,00; 100,00) | <0,001 |
| HDL-C, mmol/l | 1,00 (1,00; 1,03) | 0,92 (0,84; 1,00) | <0,001 |
| TG, mmol/l | 1,75 (1,49; 2,13) | 2,30 (2,00; 2,500) | <0,001 |
| FG, mmol/l | 3,60 (3,40; 4,33) | 4,20 (3,60; 4,70) | 0,011 |
| INS, μU/ml | 5,30 (3,80; 7,00) | 7,30 (5,15; 12,28) | 0,013 |
| HOMA2-IR, cu | 0.63 (0.45; 0.87) | 0.96 (0,67; 1,64) | 0,001 |
| HOMA2-В, cu | 143,24 (110,50; 168,38) | 158,50 (114,60; 191,40) | NS |
| TyG, cu | 8,58 (8.33; 8,80) | 8,93 (8,66; 9,17) | <0,001 |
| FSH, IU/l | 9,10 (5,40; 49,33) | 32,75 (6,85; 74,58) | 0,066 |
| E2, pg/ml | 280,76 (73,40; 442,75) | 73,40 (73,40; 269,25) | NS |
Note: р1-2 ̶significance of differences between groups 1 и 2; NS – non-significant.
The groups did not differ statistically in the parameters of the functional state of the pituitary-ovarian axis due to the high variability of FSH and E2 levels depending on the period of MT. Taking into account the tendency for differences between the groups in FSH levels (Table 1), the older age of women in group 2 and, accordingly, different stages of MT, the groups were compared by the FSH level>/<25 mIU/L (30% and 52% in groups 1 and 2, respectively), their statistical difference was revealed (Pearson criterion χ2=3.781, p=0.052). Age correlated with all parameters of MetS and perimenopause (Table 2), especially closely with FSH and DPM, which served as an additional basis, in addition to the statistical difference in this indicator between the groups depending on the presence of hypertension (Table 1), for conducting a partial correlation in order to level out the influence of age.
| Age | Parameter |
|---|---|
| WC | 0,456 < 0,001 |
| BMI | 0,382 < 0,001 |
| SBP | 0,374 < 0,001 |
| DBP | 0,306 0,004 |
| FG | 0,309 0,004 |
| TG | 0,236 0,027 |
| HDL-C | -0,29 0,006 |
| DPM | 0,707 < 0,001 |
| FSH | 0,543 < 0,001 |
| E2 | -0,336 0,001 |
Note: R – Spearman’s correlation coefficient.
Our earlier analysis of the correlations between the characteristics of MetS and the levels of INS, HOMA2-IR and TyG indices served as the basis for further analysis to select TyG. It showed the presence of more extensive and close relationships, and all its associations, including INS and HOMA2-IR, remained significant with partial correlation, reflecting only partial dependence on age. In contrast, INS and HOMA2-IR, when corrected for age, correlated only with WC, TG and TyG levels. Of the anthropometric parameters, WC was selected taking into account its more significant associations with TyG in both types of correlation analysis, both in comparison with HOMA2-IR and with BMI (Table 3).
| correlation coefficient | Spearman’s correlation | partial correlation |
|---|---|---|
| TyG | 0,526*** | 0,424*** |
| HOMA2-IR | 0,507*** | 0,370*** |
| WC | 0,437*** | 0,373** |
| BMI | 0,393*** | 0,292** |
Note: * – significance of differences ≤0,05; ** ≤0,01; *** ≤0,001.
The TyG index independently correlated with HDL-C, WC and INS (R=0,550; p<0,001; Rpc=0,409; p<0,001), and to a lesser extent with SBP, DBP and DPM. The relationships between TyG levels and FSH were age-dependent. The Spearman correlation of FSH with DPM (R=0,622; p<0,001) significantly weakened (Rpc=0,273; p<0,01) when the effect of age was leveled.
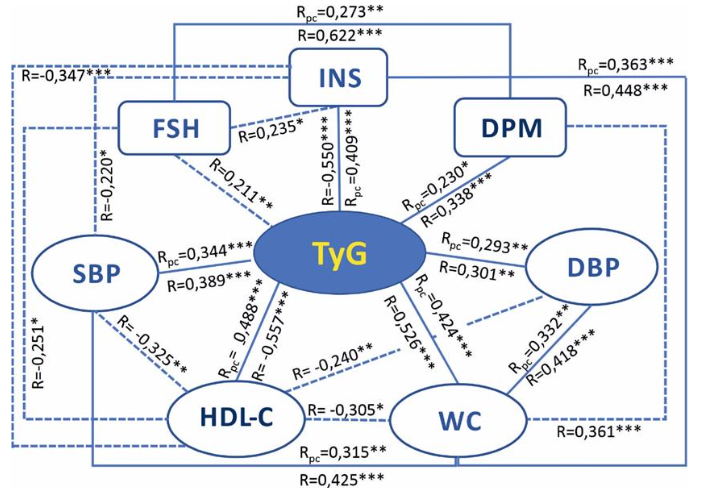
The correlations of WC were stable with BMI, TyG, SBP and DBP levels, and age-dependent with HDL-C and DMP. Fasting glucose, an important marker of MetS, was not included in the analysis, since it is included in the formula for calculating the TyG index. The correlations of FG with the parameters of MetS and perimenopause in comparison with TyG (Table 4) are weaker and do not correlate with DBP and FSH, however, FG is age-dependently associated with estradiol levels (Table 4).
| Glucose | Parameter |
|---|---|
| WC | 0,444 < 0,001 |
| SBP | 0,286 0,007 |
| DBP | 0,171 NS |
| INS | 0,562 < 0,001 |
| TG | 0,337 0,001 |
| HDL-C | -0,397 < 0,001 |
| DPM | 0,3543 < 0,001 |
| FSH | 0,133 NS |
| E2 | -0,220 0,040 |
Note: R – Spearman’s correlation coefficient.; Rpc – partial correlation; р- significant NS – non-significant.
To identify associations of the studied parameters with the probability of hypertension, a univariate logistic analysis with age standardization was performed (Table 5). It included WC and HDL-C (as the main parameters of MetS) and TyG index, the logarithmic ratio of two more components of MetS, reflecting the baseline insulin resistance, a key factor in many metabolic disorders. Hemodynamic parameters as a characteristic of hypertension were excluded from the analysis.
| Parameter | Statistical parameters |
|---|---|
| WC | 0,093 0,001 1,097 1,038 1,160 84,5 53,3 |
| TyG | 3,409 0,001 30,246 4,409 207,484 86,2 53,3 |
| HDL-C | -11,427 0,003 0,001 0,0001 0,021 84,5 40,0 |
Note: Models are standardized by age.
Next, a multiple logistic regression analysis was performed, which additionally included two parameters, INS and FSH, taking into account their statistical significance (Table 1), as well as a close relationship with the menopausal transition (FSH as an early responding hormone of changes in the functional state of the pituitary-ovarian axis in perimenopause). When including these parameters in model (1), WC (OR = 1.093; p = 0.013) and HDL-C (OR = 0.001; p = 0.023) were statistically significantly associated with the presence of hypertension. The sensitivity of model (1) was 87.9%; specificity 60.0% (Table 6).
| Parameter | Statistical parameters |
|---|---|
| Age | 0,088 0,172 1,092 0,962 1,240 |
| INS | -0,057 0,284 0,944 0,851 1,049 |
| WC | 0,089 0,013 1,093 1,019 1,171 |
| FSH | -0,004 0,673 0,996 0,977 1,015 |
| TyG | 1,859 0,139 6,416 0,547 75,199 |
| HDL-C | -10,173 0,023 0,001 0,0001 0,247 |
Note: B – regression coefficient, OR – odds ratio, CI – 95% confidence interval for OR; Se=87,9%; Sp=60,0%.
When excluding TYG from the logistic regression model (1), the sensitivity and specificity of model (2) were 84.5% and 60%, respectively, which, when compared with model (1), with similar specificity, is characterized by a decrease in sensitivity (Table 7).
| Parameter | Statistical parameters |
|---|---|
| Age | 0,079 0,203 1,082 0,958 1,221 |
| INS | -0,028 0,607 0,972 0,873 1,082 |
| WC | 0,101 0,003 1,106 1,034 1,184 |
| FSH | -0,004 0,677 0,996 0,978 1,014 |
| HDL-C | -12,205 0,004 0,001 0,0001 0,023 |
Note: B – regression coefficient, OR – odds ratio, CI – 95% confidence interval for OR; Se=84,5%; Sp=60,0%.
When including TYG and excluding HDL-C (model 3), the sensitivity of the model remains 87.9%, the specificity increases compared to models (1) and (2) and is 63.3%, which serves as the basis for considering model 3 as the working model for further analysis (Table 8). There is a need to identify the cutoff point for the TyG index in this cohort of women, taking into account ethnic and gender characteristics in numerous studies of the prognostic role of TyG.
| Parameter | Statistical parameters |
|---|---|
| Age | 0,084 0,169 1,087 0,965 1,225 |
| INS | -0,041 0,389 0,960 0,873 1,054 |
| WC | 0,075 0,021 1,078 1,011 1,150 |
| FSH | -0,001 0,925 0,999 0,982 1,017 |
| TyG | 3,095 0,007 22,089 2,346 207,995 |
Note: B – regression coefficient, OR – odds ratio, CI – 95% confidence interval for OR; Se=87,9%; Sp=63,3%.
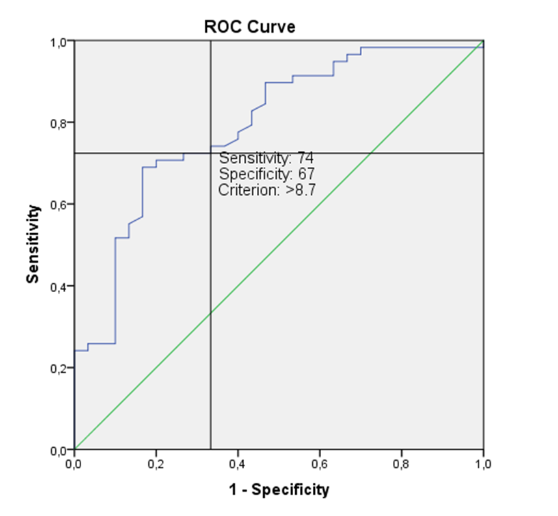
Using ROC analysis, a cutoff point was determined for the TYG indicator – 8.7 conventional units, at which the ratio of sensitivity and specificity of the diagnostic test (the presence and absence of hypertension) was optimal. The area under the curve (AUC) was 0.793 (95% CI: 0.694-0.892), p <0.0001; sensitivity (Se) 74%, specificity (Sp) 67%, which indicates good quality of the diagnostic test.
Discussion
In the studied cohort of perimenopausal women, age significantly correlated with all parameters of MetS and perimenopause (Table 2), most strongly with hormonal characteristics of the pituitary-ovarian axis and DPM, drawing attention to the characteristics of reproductive health and the timing of menopause. Without going into detail in the discussion of the features of chronological and biological age, we note that human aging beyond the reproductive age (after menopause in women) can proceed in several directions: evolutionarily neutral, with acceleration, or favor a slow program. When developing a comprehensive identification of phenotypic age as a marker of biological aging, a variety of data were introduced through integration, hypertension and obesity were included from clinical data, lipid and carbohydrate characteristics from biochemical data, that is, MetS markers. Our study is consistent with a similar strategy.
Given the prevalence of traditional CVD risk factors (family history, smoking, hypertension, overweight, dyslipidemia, T2DM) in old age, it is important to consider specific factors associated with changes in sex hormones during previous life, which affect CMR at any age, in middle-aged or young women. An association between menopause and an increased risk of CVD is noted in early menopause (<45 years), which is traditionally explained by the loss of the protective effect of endogenous estrogens.
Significant multidirectional associations of FSH and E2 with age reflect changes in the functional state of the pituitary-ovarian axis during MT (Table 2); the absolute value of the direct association of age with FSH was stronger in contrast to the association with E2, which is consistent with the dynamics of estradiol and FSH levels according to the stages of reproductive aging. In contrast to the wide fluctuations in estradiol at the onset of menopause to consistently low levels in postmenopause, FSH levels rise steadily beginning in premenopause. By this point in life, the follicles are virtually exhausted and cannot synthesize sufficient estrogens to reverse the effects on the hypothalamus and pituitary gland. As a result, excess gonadotropins are continually secreted, further accelerating follicular depletion until menopause.
Initiation and progression of MetS parameters in women, closely related to both chronological and reproductive aging, often secondary to menopause, are closely linked by insulin resistance. Clinically, IR is also manifested by metabolic consequences: hyperglycemia, hypertension, dyslipidemia, accumulation of visceral adipose tissue (VAT) and endothelial dysfunction (ED), which contribute to accelerated CVR. The simplest indicator for clinical alertness regarding insulin resistance is WC, a MetS marker reflecting the accumulation of VAT. We chose WC taking into account its more significant correlations with TyG in comparison with HOMA2-IR and with BMI. Reflecting disturbances in the biological response to insulin stimulation, primarily in target tissues, liver, muscle, and adipose tissue, insulin resistance plays a key role in the development and progression of many CMDs, which is explained by the wide range of metabolic effects of insulin in various organs and tissues.
The need for a quantitative assessment of IR has determined the development of a large number of surrogate indices, starting with HOMA-IR. Surrogate IR indices tested using the euglycemic test were initially used to assess dysglycemia and later began to be used to predict CVD. It is believed that the non-insulin TyG index, reflecting not only glucose metabolism but also aspects of lipid metabolism that are not covered by HOMA-IR, is superior to it in predictive accuracy.
Glucose and lipid metabolism disorders, in particular elevated TG and FG levels, are known risk factors for hypertension and also reflect the IR status in the liver and adipocytes. A meta-analysis of twenty observational studies (n= 451 455) demonstrated the reliability of the TyG as a prognostic marker of MACE in patients with hypertension, with the highest risk noted in young adults with hypertension, especially in women. Since the TyG index is based on TG and FG parameters, its level may theoretically depend on dyslipidemia and the patient’s diabetic status. The possibility of using the index in the population regardless of age, diabetes status and gender has been confirmed.
The TyG index, in the absence of associations with E2, correlated age-dependently with FSH levels. Our earlier correlation analysis in a group of perimenopausal patients with hypertension revealed positive TyG relationships with FSH and negative relationships with E2. The relationship between FSH and TyG (more stable in the subgroup of women with hypertension), in combination with the staging of MT according to STRAW+10, determines the interest in the role of FSH during perimenopause. Evidence is accumulating of extragonadal functions of FSH after detection of expression of its receptors on blood vessels, adipose tissue, liver, osteoclasts, neurons of the hippocampus and cortex. The correlations of the TyG index with the DPM in both types of correlation analysis reflect the relationship of IR with the chronological and reproductive aging.
The triangle of correlations TyG-DPM -FSH-TyG, where age is a dependent relationship of TyG with FSH, in contrast to this relationship in the subgroup of patients with hypertension, which is significant even when the influence of age is leveled, possibly reflects accelerated aging in hypertension. This assumption also takes into account the influence of age on the relationship of TyG with BP levels, that is, through the mechanisms of IR with hypertension playing the leading role in this tandem, returning us to the peculiarities of reproductive aging of women.
The risk of developing MetS increases with years after menopause, but the full impact of DPM remains unclear. It was DPM that was found to be the most important risk factor for MetS when it lasted more than 5 years; the cited study did not analyze the indices of the functional state of the pituitary-ovarian axis. The effect of DPM on TyG is weaker than the associations of the IR index with the MetS markers, drawing attention to the possibility of using these indices in the prognosis of hypertension. The observed associations with WC reflect key metabolic changes in perimenopause: the accumulation of VAT and IR, which together contribute to a marked increase in the risk of MetS and CVD. The obesity phenotype is fundamentally important in terms of CMR; WC serves as a simple marker of abdominal obesity. Although the increase in VAT during MT is well documented, the underlying causes and mechanisms have not been studied in detail. Hormonal changes including hypoestrogenemia, hypergonadotropinemia, relative hyperandrogenemia, growth hormone deficiency, leptin resistance and chronic stress affecting the hypothalamic-pituitary-adrenal axis have been implicated in the initiation of perimenopausal obesity.
Changes in CMR factors occur during MT, which is divided into two subcategories: perimenopause (early and late) and postmenopausal years. In women, CMR is influenced by other reproductive factors: age of menarche, gestational diabetes and hypertension, PCOS, premature ovarian failure, determining the complexity of the problem.
Initially, the accumulation VAT was mainly associated with the decline in estrogens. Although E2 concentrations are lower in early postmenopause compared to premenopause, the patterns of E2 decline and FSH increase in perimenopause are heterogeneous. Consistent with the concept of an “atypical pituitary hormone–target tissue axis”, the presence of FSH receptors in VAT reflects the involvement of FSH in postmenopausal visceral obesity and may contribute to a proinflammatory environment; chronic inflammation is an important marker of aging.
Since the decrease in E2 values and the increase in FSH levels during MT have a significant overlap period, and ovarian hormones significantly affect FSH levels, further clinical studies are needed to determine the role of FSH in this process: primary or secondary. We did not find any direct associations of WC with FSH levels, but WC consistently correlates with TyG, which interacts with gonadotropin levels in an age-dependent manner, similar to the nature of the relationship between WC and DPM. At the same time, DPM correlates with FSH, maintaining the effect of age. The data obtained return to the problem of chronological and reproductive aging, touching upon the situation with increased accumulation of VAT in perimenopause. The fully age-dependent correlation of DPM with WC is consistent with the view that the main factor determining weight gain is not menopause, but age, but hormonal changes in WC significantly contribute to the increase in VAT associated with IR. In the studied cohort, WC forms a complex of relationships with the characteristics of MetS and DPM, the closest with TyG. Thus, both aging and hormonal influences, as well as lifestyle factors: alcohol consumption, physical exercise and diet, have a complex effect on the distribution of adipose tissue and its health.
Increasing evidence points to the critical role of IR in the transition from the physiological state of decreased insulin sensitivity to individual CMDs and cardiometabolic multimorbidity, closely associated with atherosclerosis. The main factor in the formation and progression of atherosclerotic plaques and cardiac dysfunction is lipid imbalance; its unfavorable change is observed already within one year after the last menstruation. Dyslipidemia, a key feature of MetS, characterized by elevated TG and reduced HDL-C levels, plays a decisive role in the progression of the cluster, with a close association of hypertriglyceridemia with IR.
In abdominal obesity, adiponectin and related biomarkers may contribute to sex-specific CMD factors. Statistically significant sex differences in HDL-C, TG, FG, insulin, HOMA-IR and adiponectin levels were demonstrated. In the studied cohort of women, HDL-C levels, differing depending on the presence of hypertension, closely correlated with TyG after age adjustment; the relationships between HDL-C and FSH, BP, INS and WC were completely age-dependent.
Protective markers, HDL-C and percentage of lean body mass, are closely associated with MetS. It is believed that a decrease in cardiovascular protective HDL-C indicates menopause as an independent risk factor for atherosclerosis. A potential marker of coronary atherosclerosis is coronary artery calcification. The cardioprotective significance of HDL-C may vary depending on the stage of MT or estradiol level and depends on HDL subclasses (small and large molecules), the level of which changes at different periods of perimenopause, complicating the prognostic interpretation of their conventional analysis. It was reported that insulin resistance values were no longer associated with CVD risk after adjustment for LDL-C in postmenopausal women without diabetes, but HOMA-IR was used as an IR marker. It is suggested that the FSH-metabolic circuit in menopause may include dyslipidemia.
However, these studies are fragmentary and contradictory, revealing closer but opposite associations of FSH with LDL-C and less close associations of gonadotropin with HDL-C and TG. In a study of the temporal relationship between blood lipids and IR in a longitudinal cohort of perimenopausal women, bidirectional relationships were observed between insulin resistance, TG, and HDL-C. These results allowed the authors, without denying dyslipidemia as a recognized risk factor for IR and diabetes, to suggest that insulin resistance may be the cause of lipid disorders; while VAT in perimenopause may contribute to the development of DLP and IR. Functional changes in the phenotype of adipose tissue with the accumulation of VAT are noted with aging, confirming the close relationship between chronological and reproductive aging in women. In the studied cohort, it is WC that more closely correlates with the TyG index, reflecting the close relationship between IR and VAT. In women, it is TG that serves as one of the most important risk factors for T2DM. However, in a study of the frequency of MetS and its prognostic factors in peri- and postmenopausal women according to the NCEP-ATP III criteria, the predominant marker was OT with a lower expression of TG.
Of particular interest is FG, an age-dependent indicator that correlates with the range of parameters studied in the absence of relationships between age and INS (R=0.191; p>0.05). Women in the study cohort had reference levels of FG, without changes in the insulin secretory capacity of β-cells assessed by HOMA2-B, which excluded dysglycemia at the time of examination. However, some increase in the levels of INS, WC and IR indices in women with hypertension and dyslipidemia reflects a further risk of dysglycemia. This is evidenced by multiple correlations of FG with the MetS and MT parameters. Note that insulin correlates positively and age-dependently with SBP and FSH levels, negatively with HDL-C levels with a more stable relationship with WC. Along with the gradual increase in IR against the background of obesity, the decrease in insulin secretion contributes to the vulnerability of glucose metabolism, with the contribution of DPM to this process, as well as subclinical coronary atherosclerosis. Key factors in this direction also include age, body mass index and hypertension; as a result, dysglycemia, in fact, completes the formation of “full” MetS.
A longitudinal nationwide Korean study found an increased odds of sequentially acquiring abnormal FG over 8 years in pre- and postmenopause, with a more consistent association in premenopause. The stronger association between obesity and T2DM in premenopause is explained by the postmenopausal synthesis of estrogens in adipose tissue via androgen aromatization, which may have a protective effect against diabetes mellitus. A compelling systematic review suggests an indirect association of FSH levels with abnormal FG in postmenopausal women. The statistically significant positive correlations of FG with DPM and negative correlations with E2, with its characteristic decrease in the late stage of MT and no association with FSH, are also logically consistent with a higher probability of dysglycemia in the late phase of perimenopause.
Insulin level is not part of the five MetS criteria, since measuring this parameter for screening is cumbersome, but the patterns of its relationships with MetS markers are of interest. Associations of INS with TyG and WC, stable when corrected for age, the absence of changes in HOMA2-B with a reference increase in FG, reflect the intense work of β-cells together with an increase in IR, assessed by TyG, with only a partial influence of age. An increase in INS levels in close connection with an increase in IR is at the center of a whole complex of links in the pathogenesis of MetS. It is believed that an increase in TyG is associated with a violation of β-cell function independent of glucose metabolism, and the TyG index is an alternative indicator for predicting β-cell dysfunction.
The TyG index forms a spectrum of significant associations with the characteristics of MetS and perimenopause, the closest with INS, WC and HDL-C, maintaining with partial correlation. The presence of stable associations of TyG with SBP and DBP levels indirectly reflects the participation of insulin resistance in the formation of hypertension, and the age-dependent relationship of the index with FSH and preserved with age-corrected DPM – a complex role in the dynamics of perimenopause. The obtained data serve as a basis for assessing the TyG index in predicting hypertension in normoglycemic women in perimenopause. The presence of hypertension served as a grouping variable, by which the examined women were divided into groups, with stable correlations of TyG with BP levels in the general correlation matrix.
To identify associations of the studied parameters (the main components of MetS) with the probability of hypertension, a univariate logistic analysis with age standardization was performed. All three parameters were significantly associated with hypertension, however, with the same sensitivity for WC and HDL-C (84.5%), the lipid parameter had a lower specificity (40.0%), while the TyG index, with the same specificity as WC (53.3%), had a higher sensitivity (86.2%).
The multiple logistic regression analysis additionally included the INS and FSH parameters, taking into account their statistical significance and close relationship with MT. When including the specified parameters in model (1), WC and HDL-C were statistically significantly associated with the presence of hypertension. The sensitivity of model (1) was 87.9%; specificity 60.0%. When excluding TYG from the logistic regression model, the sensitivity and specificity of model (2) were 84.5% and 60%, respectively, which, when compared with model (1), with similar specificity, is characterized by a decrease in sensitivity. At the same time, when including TYG and excluding HDL-C, the sensitivity of the model remains 87.9%, and the specificity increases compared to models (1) and (2).
Thus, this model, including OT and TyG, generally accepted markers of IR, as well as insulin (as an indicator of the compensatory function of β-cells with an increase in OT and TyG), with the inclusion of FSH (the first hormone of the pituitary-ovarian axis, the change in which marks premenopause and, accordingly, reproductive aging) and age (as an indicator of chronological aging), reflects the chance of having hypertension in a cohort of perimenopausal women. There is a need to identify a cutoff point for the TyG index, taking into account ethnic and gender characteristics in the prognostic and diagnostic role of TyG. Using ROC analysis, a cutoff point for the TYG indicator was determined – 8.7 conventional units, at which the ratio of sensitivity and specificity of the diagnostic test (the presence and absence of hypertension) turned out to be optimal. The area under the curve (AUC) was 0.793 (95% CI: 0.694-0.892), p <0.0001; sensitivity (Se) 74%, specificity (Sp) 67%, which indicates good quality of the diagnostic test.
Conclusion
Early cardiovascular protection depends on the accuracy of risk prediction with insulin resistance playing a critical role, determining the importance of searching for simple, informative biomarkers of IR. The TyG index is increasingly recognized for assessing IR and cardiometabolic risk in individuals without diabetes, including hypertension, with the expectation that it will become an alternative to the clamp test. The interaction of multiple risk factors in the pathogenesis of CVD suggests additional prognostic value for integrated parameters such as TyG. The study of the relationship between the TyG index and hypertension is one of the most pronounced trends in recent years, confirmed by current bibliographic analysis. TyG associations with hypertension are multifaceted: links with prognosis, different stages and phenotypes of hypertension, their progression, could serve as a surrogate indicator for early treatment of hypertension, and can also be used in the population regardless of age, diabetic status and gender. Although the positive relationship between the TyG index and the development of hypertension is reasonably presented in current meta-analyses, the gender specificity of these associations requires additional research. In the existing literature, such data regarding the stages of MT are rare.
Conflict of interests
The authors declare that the research was conducted in the absence of any commercial or financial relationships that could be construed as a potential conflict of interest.
Authorship
L.A. Ruyatkina – idea, concept and design of the study, analysis and interpretation of the data obtained, writing the text of the article, editing the text of the manuscript; D.S. Ruyatkin – idea, concept and design of the article, collection and processing of material, analysis of the data obtained, writing the text of the article; L.V. Shcherbakova – ideas for statistical data analysis and participation in its implementation.
References
- Cybulska AM, Schneider-Matyka D, Wieder-Huszla S, Panczyk M, Jurczak A, Grochans E. Diagnostic markers of insulin resistance to discriminate between prediabetes and diabetes in menopausal women. Eur Rev Med Pharmacol Sci. 2023;27(6):2453-2468. https://doi.org/10.26355/eurrev_202303_31779
- Uddenberg ER, Safwan N, Saadedine M, Hurtado MD, Faubion SS, Shufelt CL. Menopause transition and cardiovascular disease risk. Maturitas. 2024;185:107974. https://doi.org/10.1016/j.maturitas.2024.107974
- Wood K, McCarthy S, Pitt H, Randle M, Thomas SL. Women’s experiences and expectations during the menopause transition: a systematic qualitative narrative review. Health Promot Int. 2025;40(1):daaf005. https://doi.org/10.1093/heapro/daaf005
- Meloni A, Cadeddu C, Cugusi L et al. Gender Differences and Cardiometabolic Risk: The Importance of the Risk Factors. Int J Mol Sci. 2023;24(2):1588. https://doi.org/10.3390/ijms24021588
- Moreau KL. Intersection between gonadal function and vascular aging in women. J Appl Physiol (1985). 2018;125(6):1881-1887. https://doi.org/10.1152/japplphysiol.00117.2018
- Clayton GL, Soares AG, Kilpi F et al. Cardiovascular health in the menopause transition: a longitudinal study of up to 3892 women with up to four repeated measures of risk factors. BMC Med. 2022;20(1):299. https://doi.org/10.1186/s12916-022-02454-6
- Mehta JM, Manson JE. The menopausal transition period and cardiovascular risk. Nat Rev Cardiol. 2024;21(3):203-211. https://doi.org/10.1038/s41569-023-00926-7
- Nair AR, Pillai AJ, Nair N. Cardiovascular Changes in Menopause. Curr Cardiol Rev. 2021;17(4):e230421187681. https://doi.org/10.2174/1573403X16666201106141811
- El Khoudary SR, Aggarwal B, Beckie TM et al. American Heart Association Prevention Science Committee of the Council on Epidemiology and Prevention; and Council on Cardiovascular and Stroke Nursing. Menopause Transition and Cardiovascular Disease Risk: Implications for Timing of Early Prevention: A Scientific Statement From the American Heart Association. Circulation. 2020;142(25):e506-e532. https://doi.org/10.1161/CIR.0000000000000912
- Tan A, Thomas RL, Campbell MD, Prior SL, Bracken RM, Churm R. Effects of exercise training on metabolic syndrome risk factors in post-menopausal women – A systematic review and meta-analysis of randomised controlled trials. Clin Nutr. 2023;42(3):337-351. https://doi.org/10.1016/j.clnu.2023.01.008
- Kautzky-Willer A, Leutner M, Harreiter J. Sex differences in type 2 diabetes. Diabetologia. 2023;66(6):986-1002. doi: 10.1007/s00125-023-05891-x. Epub 2023 Mar 10. Erratum in: Diabetologia. 2023;66(6):1165. https://doi.org/10.1007/s00125-023-05913-8
- Tian Z, Yang L, Li Y, Huang Y, Yang J, Xue F. Associations of different insulin resistance-related indices with the incidence and progression trajectory of cardiometabolic multimorbidity: a prospective cohort study from UK biobank. Cardiovasc Diabetol. 2025;24(1):257. https://doi.org/10.1186/s12933-025-02819-0
- Wang, Y, Chen, Z, Huo, Z. et al. Metabolic Syndrome Evolution and Cardio-Kidney-Metabolic Multimorbidity: Implications for Targeted Prevention. JACC Adv. 2025, 4 (6_Part_2). https://doi.org/10.1016/j.jacadv.2025.101778
- Zhang W, Chen C, Li M, Yan G, Tang C. Sex Differences in the Associations among Insulin Resistance Indexes with Metabolic Syndrome: A Large Cross-Sectional Study. Int J Endocrinol. 2024; 2024:3352531. https://doi.org/10.1155/2024/3352531
- Santilli F, D’Ardes D, Guagnano MT, Davi G. Metabolic Syndrome: Sex-Related Cardiovascular Risk and Therapeutic Approach. Curr Med Chem. 2017;24(24):2602-2627. https://doi.org/10.2174/0929867324666170710121145
- Stanciu S., Rusu E., Miricescu D. et al. Links between Metabolic Syndrome and Hypertension: The Relationship with the Current Antidiabetic Drugs. Metabolites. 2023;13(1):87. https://doi.org/10.3390/metabo13010087
- Guldan M, Unlu S, Abdel-Rahman SM et al. Understanding the Role of Sex Hormones in Cardiovascular Kidney Metabolic Syndrome: Toward Personalized Therapeutic Approaches. J Clin Med. 2024;13(15):4354. https://doi.org/10.3390/jcm13154354
- Roa-Díaz ZM, Raguindin PF, Bano A, Laine JE, Muka T, Glisic M. Menopause and cardiometabolic diseases: What we (don’t) know and why it matters. Maturitas. 2021, 152:48-56. https://doi.org/10.1016/j.maturitas.2021.06.01
- Ruyatkina LA, Ruyatkin DS; Shcherbakova LV. Hormonal-metabolic trajectory of menopausal transition in a normoglycemic cohort of women with different blood pressure levels. Medical Research Archives, [S.l.], v. 12, n. 1, jan. 2024. ISSN 2375-1924. Available at: https://esmed.org/MRA/mra/article/view/4972. Date accessed: 07 july 2025. doi: https://doi.org/10.18103/mra.v12i1.4972
- Jeong HG, Park H. Metabolic Disorders in Menopause. Metabolites. 2022;12(10):954. https://doi.org/10.3390/metabo12100954
- Lee EJ, Keller-Ross ML. Menopause and its effects on autonomic regulation of blood pressure: Insights and perspectives. Auton Neurosci. 2025;260:103295. https://doi.org/10.1016/j.autneu.2025.103295
- Martin SS, Aday AW, Almarzooq ZI et al. American Heart Association Council on Epidemiology and Prevention Statistics Committee and Stroke Statistics Subcommittee. 2024 Heart Disease and Stroke Statistics: A Report of US and Global Data From the American Heart Association. Circulation. 2024;149(8):e347-e913. doi: 10.1161/CIR.0000000000001209. Epub 2024 Jan 24. Erratum in: Circulation. 2024 May 7;149(19):e1164. doi: 10.1161/CIR.0000000000001247. Erratum in: Circulation. 2025;151(25):e1095. https://doi.org/10.1161/CIR.0000000000001344
- De Paoli M, Zakharia A, Werstuck GH. The Role of Estrogen in Insulin Resistance: A Review of Clinical and Preclinical Data. Am J Pathol. 2021;191(9):1490-1498. https://doi.org/10.1016/j.ajpath.2021.05.011
- Ciarambino T, Crispino P, Guarisco G, Giordano M. Gender differences in insulin resistance: new knowledge and perspectives. Curr Issues Mol Biol. 2023;45(10):7845-7861. https://doi.org/10.3390/cimb45100496
- Nappi RE, Chedraui P, Lambrinoudaki I, Simoncini T. Menopause: a cardiometabolic transition. Lancet Diabetes Endocrinol. 2022;10(6):442-456. https://doi.org/10.1016/S2213-8587(22)00076-6
- Ruyatkina L.A., Ruyatkin D.S., Iskhakova I.S. Opportunities and options for surrogate assessment of insulin resistance. Obesity and metabolism. 2019;16(1):27-33. (In Russ.). https://doi.org/10.14341/omet10082
- Majnarić LT, Martinović I, Šabanović Š, Rudan S, Babič F, Wittlinger T. The Effect of Hypertension Duration and the Age of Onset on CV Risk Factors Expression in Perimenopausal Women. Int J Hypertens. 2019; 2019:9848125. https://doi.org/10.1155/2019/9848125
- Li Q, Wang X, Ni Y et al. Epidemiological characteristics and risk factors of T2DM in Chinese premenopausal and postmenopausal women. Lipids Health Dis. 2019;18(1):155. https://doi.org/10.1186/s12944-019-1091-7
- Chikwati RP, Chikowore T, Mahyoodeen NG, Jaff NG, George JA, Crowther NJ. The association of menopause with cardiometabolic disease risk factors in low- and middle-income countries: a systematic review and meta-analyses. Menopause. 2024;31(1):77-85. https://doi.org/10.1097/GME.0000000000002292
- Li C, Zhang Z, Luo X et al. The triglyceride-glucose index and its obesity-related derivatives as predictors of all-cause and cardiovascular mortality in hypertensive patients: insights from NHANES data with machine learning analysis. Cardiovasc Diabetol. 2025;24(1):47. https://doi.org/10.1186/s12933-025-02591-1
- Mishra A, Alam F, Mateen S, Jabeen F, Anjum M, Mamrawala N. Fragmented ventricular complexes and blood pressure variability assessed by ambulatory blood pressure monitoring in patients with metabolic syndrome. Cureus. 2024;16(5): e59950. https://doi.org/10.7759/cureus.59950.5
- Mancia G, Kreutz R, Brunström M et al. 2023 ESH Guidelines for the management of arterial hypertension. The Task Force for the management of arterial hypertension of the European Society of Hypertension: Endorsed by the International Society of Hypertension (ISH) and the European Renal Association (ERA). J Hypertens. 2023;41(12):1874-2071. https://doi.org/10.1097/HJH.0000000000003480
- Li S, Tan I, Atkins E, Schutte AE, Gnanenthiran SR. The pathophysiology, prognosis and treatment of hypertension in females from pregnancy to postmenopause: a review. Curr Heart Fail Rep. 2024;21(4):322-336. https://doi.org/10.1007/s11897-024-00672-y
- Lambrinoudaki I, Armeni E. Understanding of and clinical approach to cardiometabolic transition at the menopause. Climacteric. 2024;27(1):68-74. https://doi.org/10.1080/13697137.2023.2202809
- Hezam AAM, Shaghdar HBM, Chen L. The connection between hypertension and diabetes and their role in heart and kidney disease development. J Res Med Sci. 2024; 29:22. https://doi.org/10.4103/jrms.jrms_470_23
- Xie E, Cai H, Ye Z et al. Association of prediabetes and insulin resistance on prognosis of patients with moderate-to-severe coronary artery calcification: a prospective cohort study. Cardiovasc Diabetol. 2025;24(1):262. https://doi.org/10.1186/s12933-025-02807-4
- Li Z, Kang S, Kang H. Development and validation of nomograms for predicting cardiovascular disease risk in patients with prediabetes and diabetes. Sci Rep. 2024;14(1):20909. https://doi.org/10.1038/s41598-024-71904-3
- Rao X, Xin Z, Yu Q et al. Triglyceride-glucose-body mass index and the incidence of cardiovascular diseases: a meta-analysis of cohort studies. Cardiovasc Diabetol. 2025;24(1):34. https://doi.org/10.1186/s12933-025-02584-0
- Sherling DH, Perumareddi P, Hennekens CH. Metabolic Syndrome: Clinical and Policy Implications of the New Silent Killer. Journal of Cardiovascular Pharmacology and Therapeutics. 2017;22(4):365-367. https://doi.org/10.1177/1074248416686187
- Wolosowicz M, Prokopiuk S, Kaminski TW. Recent Advances in the Treatment of Insulin Resistance Targeting Molecular and Metabolic Pathways: Fighting a Losing Battle? Medicina (Kaunas). 2022;58(4):472. https://doi.org/10.3390/medicina58040472
- Pascual-Morena C, Cavero-Redondo I, Martínez-García I et al. Exploring the influence of insulin resistance on arterial stiffness in healthy adults: from the metabolic and cardiovascular health insights of the EVasCu Study. Nutrients. 2024;16(6):791. https://doi.org/10.3390/nu16060791
- Mancusi C, Izzo R, di Gioia G, Losi MA, Barbato E, Morisco C. Insulin resistance the hinge between hypertension and type 2 diabetes. High Blood Press Cardiovasc Prev. 2020;27(6):515-526. https://doi.org/10.1007/s40292-020-00408-8
- Liao J, Wang L, Duan L et al. Association between estimated glucose disposal rate and cardiovascular diseases in patients with diabetes or prediabetes: a cross-sectional study. Cardiovasc Diabetol. 2025;24(1):13. https://doi.org/10.1186/s12933-024-02570-y
- Gounden V, Devaraj S, Jialal I. The role of the triglyceride-glucose index as a biomarker of cardio-metabolic syndromes. Lipids Health Dis. 2024;23(1):416. https://doi.org/10.1186/s12944-024-02412-6
- Chen X, Yang J, Wang D et al. Impact of triglyceride-glucose index on risk of cardiovascular disease among non-diabetic hypertension patients: a 10-year prospective cohort study. BMC Public Health. 2025;25(1):326. https://doi.org/10.1186/s12889-025-21522-z
- D’Elia L. Is the triglyceride-glucose index ready for cardiovascular risk assessment? Nutr Metab Cardiovasc Dis. 2025;35(3):103834. https://doi.org/10.1016/j.numecd.2024.103834
- Blicher MK, Frary C, Pareek M et al. Triglyceride-glucose index improves risk prediction beyond traditional risk factors and hypertension mediated organ damage in healthy adults. Nutr Metab Cardiovasc Dis. 2024;34(11):2446-2454. https://doi.org/10.1016/j.numecd.2024.06.010
- Di Fiore V, Cappelli F, Del Punta L et al. Novel Techniques, Biomarkers and Molecular Targets to Address Cardiometabolic Diseases. J Clin Med. 2024;13(10):2883. https://doi.org/10.3390/jcm13102883
- Pontiroli AE, La Sala L, Tagliabue E et al. Evaluating the Prognostic Value of the Triglyceride-Glucose Index in Different Populations: A Critical Analysis. Nutrients. 2025;17(7):1124. https://doi.org/10.3390/nu17071124
- Avagimyan A, Pogosova N, Fogacci F et al. Triglyceride-glucose index (TyG) as a novel biomarker in the era of cardiometabolic medicine. Int J Cardiol. 2025; 418:132663. doi: 10.1016/j.ijcard.2024.132663. Epub 2024 Oct 18. Erratum in: Int J Cardiol. 2025 Feb 15; 421:132907. https://doi.org