


Global Obesity Trends Linked to Macronutrient Supply
Global variation in obesity of males and females is differentially associated with dietary macronutrient supply
Chaoqun Niu1,2 and John Roger Speakman1,2,
- Shenzhen Key Laboratory of Metabolic Health, Center for Energy Metabolism and Reproduction, Shenzhen Institute of Advanced Technology, Chinese Academy of Sciences, Shenzhen, China; State Key Laboratory of Molecular Developmental Biology, Institute of Genetics and Developmental Biology, Chinese Academy of Sciences, Beijing, China
- Shenzhen Key Laboratory of Metabolic Health, Center for Energy Metabolism and Reproduction, Shenzhen Institute of Advanced Technology, Chinese Academy of Sciences, Shenzhen, China; State Key Laboratory of Molecular Developmental Biology, Institute of Genetics and Developmental Biology, Chinese Academy of Sciences, Beijing, China; Institute of Biological and Environmental Sciences, University of Aberdeen, Aberdeen, UK
OPEN ACCESS
PUBLISHED: 31 January 2025
CITATION: NIU, Chaoqun; SPEAKMAN, John Roger. Global variation in obesity of males and females is differentially associated with dietary macronutrient supply. Medical Research Archives, Available at: <https://esmed.org/MRA/mra/article/view/6137>.
COPYRIGHT: © 2025 European Society of Medicine. This is an open-access article distributed under the terms of the Creative Commons Attribution License, which permits unrestricted use, distribution, and reproduction in any medium, provided the original author and source are credited.
DOI: https://doi.org/10.18103/mra.v13i1.6137
ISSN 2375-1924
Abstract
Obesity prevalence varies widely across countries, as does the difference in prevalence between the sexes. To explore the relationship between obesity prevalence in female and male adults across different countries and country level food supply data, we used country level obesity prevalence data from the WHO, and food supply data from FAO to fit multiple regression models. In males both absolute fat and sugar energy supply were associated with obesity prevalence. However, in females only absolute sugar supply was significant. In both sexes relative fat and sugar energy supply (as a % of the overall energy) were significant predictors of obesity prevalence. Protein supply whether expressed as absolute or % of energy was unrelated to obesity prevalence in both sexes. Similarly, neither absolute nor relative carbohydrate energy supply was associated with obesity prevalence in either sex. Absolute fat and sugar energy supply were significant predictors of sex difference in obesity prevalence. These data suggest country level energy supplies of both sugar and fat play important roles in obesity prevalence globally, but to different extents in males and females.
Keywords
obesity prevalence; macronutrient composition; sex difference
1. Introduction
According to the World Health Organization (WHO), there were 1.9 billion overweight adults in the world in 2016, of which 650 million were living with obesity. It is widely agreed that obesity is caused by prolonged positive energy balance, combined with a genetic predisposition rooted in our evolutionary past. Some debate has focused on whether this imbalance stems from increased energy intake or decreased energy expenditure, due to lowered physical activity. Observed levels of physical activity are lower in people with obesity compared with people with lower BMI. Moreover, studies of occupational activity suggest that over the last 60 years there has been a shift from more active occupations to more sedentary ones, perhaps driving an average expenditure change of 110 to 130 kcals per day. However, direct studies of energy expenditure suggest that the energy expended on physical activity has been constant over the past 40 years. Moreover longitudinal studies do not indicate that high levels of physical activity expenditure are protective against weight gain, or low levels predisposing. There has however been a decline in basal energy expenditure, correlated with a progressive decline in body temperature over the last 100 years. Low BMR is a predisposing factor for future weight gain. One idea is that this decline may be linked to dietary changes involving a shift from saturated to unsaturated fatty acids in the diet.
Dietary factors may not only push down expenditure but may cause over-consumption of energy. However, which of the macronutrients drives energy over-consumption has been strongly disputed, with high fat, low protein and high carbohydrate (in particular high glycemic index carbohydrates such as refined sugar) all being implicated by different researchers. Data from animals studies paints a similarly confusing picture, with some studies implicating a critical mix of fat and carbohydrate as important, but other studies suggesting protein level may be a key driver.
Sex differences exist in almost all biological processes including the regulation of energy homeostasis. Mean obesity level, as defined by body mass index (BMI) is greater in women than in men in most nations. Cross-sectional and longitudinal studies also indicate that girls have more body fat than boys in childhood and adolescence independent of age and ethnicity. Moreover, obesity prevalence in both sexes varies substantially across countries globally. Ethnicity and socioeconomic status have also been implicated as important factors linked to sex difference in adult obesity prevalence. Nevertheless, sex differences in food choice may also play an important role in determining the extent to which obesity prevalence differs between the sexes. Yet no previous studies have explored this possibility. Better understanding of the underlying mechanisms for sexual dimorphism in obesity may facilitate the development of sex-specific approaches for obesity treatment. In the present study, we used country level obesity prevalence data from the WHO, and food supply data from Food and Agriculture Organization of the United Nations (FAO) to fit multiple regression models that examined the association between food supply composition and obesity prevalence in each sex.
2. Materials and Methods
2.1 DATA SOURCES
Internationally comparable obesity prevalence estimates (%) for men and women adults in 2013 for 195 countries was downloaded from the WHO: Global Health Observatory (GHO) database. These estimates are age-standardized and adjusted for methodological differences between studies. Food supply data for over 175 countries and territories in 2013 was downloaded from the FAO: FAOSTAT (http://www.fao.org/faostat/en/#data/FBSH) including grand total value of food energy supply (kcal/capita/day), protein supply (g/capita/day), fat supply (g/capita/day), sugar supply (raw equivalent, kcal/capita/day). Sugar (raw equivalent) supply is composed of FAO Elements with codes #158 (sugar, cane, raw, centrifugal), #159 (sugar, beet, raw, centrifugal), #162 (sugar raw centrifugal), #164 (sugar refined), #168 (sugar confectionery) and #171 (sugar flavoured). Absolute fat and protein energy supply (kcal/capita/day) were calculated by multiplying the fat supply weight by 9 kcal/g and the protein supply weight by 4 kcal/g. Absolute total carbohydrate energy supply (kcal/capita/day) was calculated as the difference of the grand total energy supply and the sum of the fat and protein energy supply. Relative supply of fat/protein/carbohydrate/sugar (raw equivalent) (%) was calculated by dividing the absolute fat/protein/carbohydrate/sugar (raw equivalent) energy supply (kcal/capita/day) by the grand total value (kcal/capita/day). Income group information of all countries for the year of 2013 was downloaded from the World Bank: World Development Indicator (https://datacatalog.worldbank.org/dataset/world-development-indicators). All middle and high income counties were classified into non-low income countries. Only the 167 countries and territories that had complete data on all variables were included in the final analysis.
2.2 STATISTICS
First Pearson correlations between obesity prevalence of both sexes and potential predictors were conducted. Then we selected the absolute per capita supply for each food component and relative per capita energy supply (%) as predictor variables in multiple linear regression models respectively with an enter strategy (p of F to enter = 0.05, p of F to leave = 0.1). To correct for the effect of malnutrition, we stratified all counties into low income and non-low income groups and redid the multiple linear regression. SPSS version 22.0 was used for multiple linear regression analysis. P < 0.01 was considered statistically significant.
3. Results
3.1. OBESITY PREVALENCE IN MALES
There was a positive relationship between obesity prevalence in male adults and absolute energy supply of fat (R2 = 0.60, F(1, 165) = 243.7, p < 0.0001, Figure 1A), protein (R2 = 0.41, F(1, 165) = 115.6, p < 0.0001, Figure 1B) and sugar (raw equivalent) (R2 = 0.40, F(1, 165) = 106.8, p < 0.0001, Figure 1D). However, there was no significant relationship between obesity prevalence in males and absolute energy supply of carbohydrate (R2 = 0.01, F(1, 165) = 1.9, p = 0.169, Figure 1C).
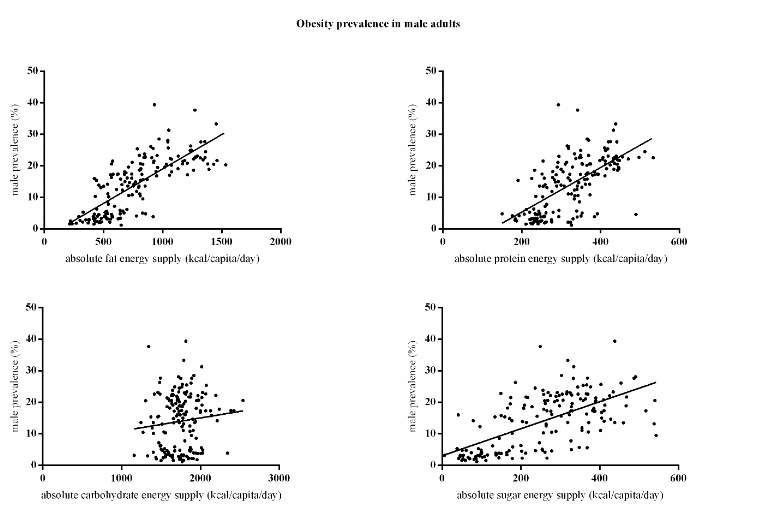
In the multiple regression model absolute per capita fat energy supply and sugar energy supply (raw equivalent) were both significant predictors of obesity prevalence in male adults, and together explained 66% of the variance in obesity prevalence (F(4, 162) = 82.43, p < 0.0001, R2 = 0.67). Absolute protein (p = 0.981), carbohydrate (p = 0.101) energy supply were not significant. An increase of one hundred kcal/capita/day fat supply increased obesity prevalence by 1.8% and one hundred kcal/capita/day sugar supply increased it by 1.9%.
Similarly, there was a positive relationship between obesity prevalence in male adults and relative energy supply of fat (R2 = 0.49, F(1, 165) = 157.5, p < 0.0001, Figure 2A), protein (R2 = 0.12, F(1, 165) = 22.5, p < 0.0001, Figure 2B), and sugar (raw equivalent) (R2 = 0.24, F(1, 165) = 51.1, p < 0.0001, Figure 2D), but there was a negative relationship between obesity prevalence in male adults and relative energy supply of carbohydrate (R2 = 0.49, F(1, 165) = 157.3, p < 0.0001, Figure 2C).
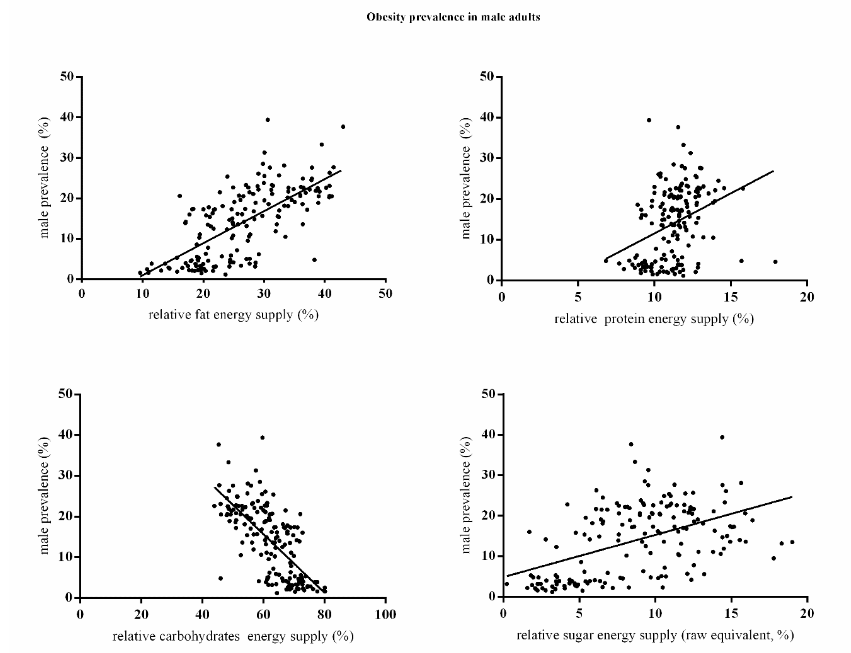
In the multiple linear regression model, relative fat and sugar energy supply were both significant positive predictors of obesity prevalence in male adults (F(3, 163) = 69.476, p < 0.0001). Relative carbohydrate energy supply was excluded because of the high collinearity with other predictors (VIF = 37.05) and relative protein energy supply was not significant (p = 0.204). The overall model explained 56% of the variance (R2 = 0.56). An increase of 10% of fat supply was related to an increase in obesity prevalence of 6.8% and 10% sugar supply to an increase of 6.0% in males.
The results in non-low income countries showed similar pattern, in the multiple linear regression model of absolute energy supply model, both fat and sugar (F(4, 137) = 50.51, p < 0.0001, R2 = 0.60) are significant predictors, but absolute protein (p = 0.822), carbohydrate (p = 0.046) energy supply were not significant. An increase of one hundred kcal/capita/day fat supply increased obesity prevalence by 1.9% and one hundred kcal/capita/day sugar supply increased it by 1.6%. In the relative energy supply model, both fat and sugar (F(3, 138) = 39.25, p < 0.0001, R2 = 0.46) are significant predictors. Relative protein (p = 0.609) energy supply were not significant. An increase of 10% fat supply increased obesity prevalence by 6.6% and 10% sugar supply increased it by 4.8%.
3.2. OBESITY PREVALENCE IN FEMALES
There was a positive relationship between obesity prevalence in female adults and absolute per capita energy supply of fat (R2 = 0.18, F(1, 165) = 36.7, p < 0.0001, Figure 3A), protein (R2 = 0.13, F(1, 165) = 23.7, p < 0.0001, Figure 3B) and sugar (raw equivalent) (R2 = 0.39, F(1, 165) = 103.5, p < 0.0001, Figure 3D). However, there was no significant relationship between obesity prevalence and absolute energy supply of carbohydrate (R2 = 0.03, F(1, 165) = 4.8, p = 0.030, Figure 3C). In the multiple linear regression model, only the absolute per capita sugar energy supply (raw equivalent) was a significant predictor of obesity prevalence (p < 0.0001), and it explained 41% of the variance in obesity prevalence (F(4, 162) = 28.05, p < 0.0001, R2 = 0.41). Absolute per capita fat (p = 0.043), protein (p = 0.348) and carbohydrate (p = 0.092) energy supply were all not significant. An increase of one hundred kcal/capita/day sugar supply was associated with a 4% increase in female obesity prevalence.

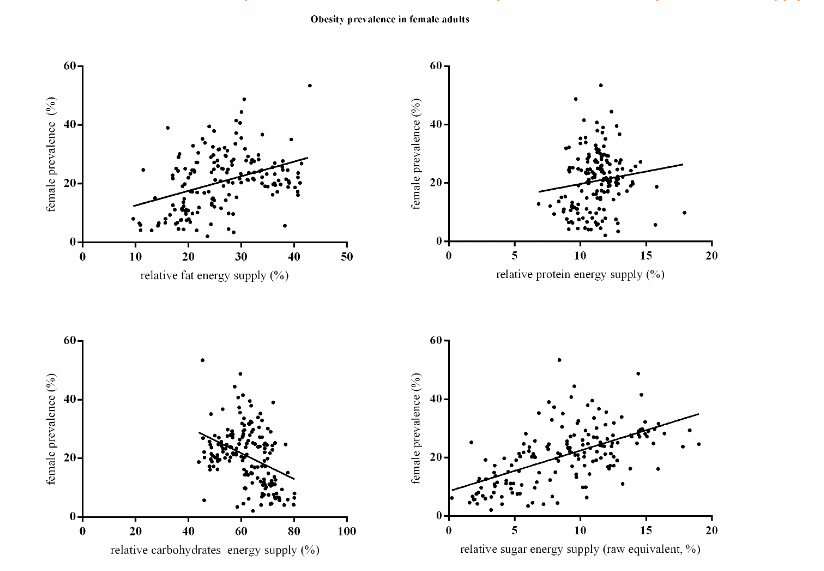
Similarly, there was a positive relationship between obesity prevalence in female adults and relative energy supply of fat (R2 = 0.15, F(1, 165) = 29.8, p < 0.0001, Figure 4A), and sugar (raw equivalent) (R2 = 0.34, F(1, 165) = 83.1, p < 0.0001, Figure 4D), and a negative relationship between obesity prevalence and relative carbohydrate energy supply (R2 = 0.15, F(1, 165) = 27.9, p < 0.0001, Figure 4C). However, there was no significant relationship between obesity prevalence and relative energy supply of protein (R2 = 0.02, F(1, 165) = 3.0, p = 0.085, Figure 4B). In the multiple linear regression model, relative fat and sugar energy supply were both significant predictors of obesity prevalence, and collectively explained 38% of the variance of obesity prevalence in females (R2 = 0.38, F(3, 163) = 32.88, p < 0.0001). Relative protein energy supply was not significant (p = 0.786). A 10% increase in fat supply was associated with a 2.8% and a 10% increase in sugar supply was associated with a 12.1% increase in obesity prevalence in female adults.
The results in non-low income countries was very similar to the overall pattern. In the multiple linear regression model of absolute energy supply model, only sugar (F(4, 137) = 13.07, p < 0.0001, R2 = 0.276). Absolute protein (p = 0.373), carbohydrate (p = 0.121) and fat (p = 0.101) energy supply were not significant. An increase of one hundred kcal/capita/day sugar supply increased it by 3.5%. In the relative energy supply model, only sugar came into the model (F(3, 138) = 14.51, p < 0.0001, R2 = 0.24). Relative protein (p = 0.597) energy supply was not significant, and relative fat was close to significant (p = 0.023). An increase of one hundred kcal/capita/day sugar supply increased it by 10.4%.
3.3. SEX DIFFERENCE IN OBESITY PREVALENCE
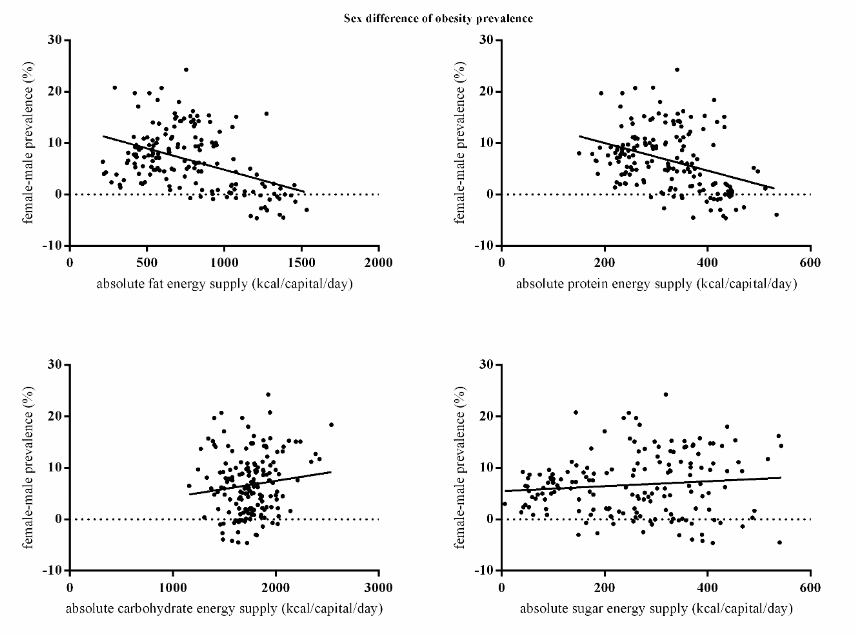
There was a negative relationship between the sex difference of obesity prevalence (female minus male) and absolute energy supply of fat (R2 = 0.19, F(1, 165) = 38.5, p < 0.0001, Figure 5A) and protein (R2 = 0.13, F(1, 165) = 24.8, p < 0.0001, Figure 5B), but there was no significant relationship between the sex difference of obesity prevalence and absolute energy supply of sugar (raw equivalent) (R2 = 0.01, F(1, 165) = 1.81, p = 0.181, Figure 5D) and carbohydrate (R2 = 0.02, F(1, 165) = 2.5, p = 0.119, Figure 5C). In the multiple linear regression model, absolute per capita fat and sugar energy supply were both significant predictors of the sex difference of obesity prevalence (F(2, 164) = 43.1, p < 0.0001), but in opposite directions with absolute fat supply negatively and sugar supply positively relating to sex difference of obesity prevalence. That is when sugar consumption increased females had increasingly greater levels of obesity compared to males, and when fat consumption increased the opposite was the case. Absolute protein (p = 0.235) and carbohydrate (p = 0.914) energy supply per capita were not significantly related to the sex difference in obesity prevalence. The model explained 34% of the variance (R2 = 0.34). An increase of 100 kcal/capita/day fat supply was related to a 1.3% decrease in the difference between females and males and a 100 kcal/capita/day sugar energy supply increase was associated with a 2.1% increase in the difference in obesity prevalence between females and males.
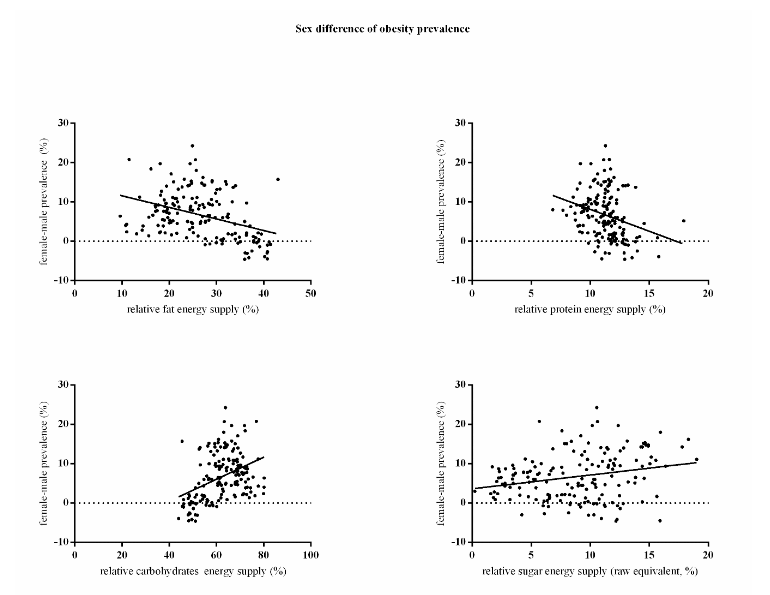
Similarly, there was a negative relationship between the sex difference of obesity prevalence in adults and relative energy supply of fat (R2 = 0.15, F(1, 165) = 28.7, p < 0.0001, Figure 6A), protein (R2 = 0.08, F(1, 165) = 15.2, p < 0.001, Figure 6B) and sugar (raw equivalent) (R2 = 0.06, F(1, 165) = 10.3, p = 0.002, Figure 6D), and a positive relationship between the sex difference of obesity prevalence and relative carbohydrate energy supply (R2 = 0.16, F(1, 165) = 32.0, p < 0.0001, Figure 6C). In the multiple linear regression model, relative carbohydrate and sugar energy supply were significant predictors of the sex difference of obesity prevalence (F(2, 164) = 39.0, p < 0.0001). Relative fat energy supply (%) was excluded due to high collinearity (VIF = 37.35), and relative protein energy supply was not significant (p = 0.564). The overall model explained 32% of the variance of sex difference of obesity prevalence (R2 = 0.32). An increase of 10% in the relative sugar supply was related to an increase in the difference between sexes of 3.8% and 10% increase in relative carbohydrate supply was associated with a 6.1% increase in the difference in obesity prevalence between females and males.
4. Discussion
Here, we performed the first ecological study on the association between country level macronutrient supply and obesity prevalence, and stratified the analysis into sex and income groups. We found that the supply of macronutrients available to a population is predictive of obesity prevalence in a sex-specific pattern. This contrasts with or supports some prevailing ideas on which macronutrient is the dietary driver of obesity.
First, the protein leverage hypothesis suggests that individuals primarily eat to meet a target intake of protein. If the protein content of food declines, then it is predicted individuals will overconsume other dietary components as they upregulate their intake to meet the protein target. This model suggests that absolute protein intakes should be relatively constant at the level of the target, and independent of obesity levels. In contrast obesity prevalence should be higher when the % protein is lower. Neither of these predictions were supported. In terms of absolute intake, the variation in protein intake was lower than the intake of fat or carbohydrate, but it was far from being constant. Moreover, there was no significant relationship between % protein and obesity prevalence, suggesting low protein contents did not drive the greater intake of carbohydrates and fats. These data contrast a recent study which suggested that low protein % was a driver of intake across 13 wealthy countries. A problem with this previous work is that the variation we observed across the much larger sample of 167 countries was such that randomly selecting that 13 countries to make the comparison could yield almost any outcome – including that observed in the previous study. Hence the previous result is possibly due to selection bias of the included countries.
Second, considerable debate has surrounded the potential roles of carbohydrates in driving the obesity epidemic. The carbohydrate-insulin model (CIM) suggests that high levels of carbohydrates stimulate insulin production which leads to a state of internal starvation in the late post-prandial phase leading to elevated hunger and more intake in a vicious cycle. We found that neither absolute nor relative total carbohydrate levels were related to obesity prevalence. However, when considering the intake of sugar alone we found contrasting results to those for total carbohydrates. Per capita sugar supply was the only dietary correlate of obesity prevalence in females and one significant factor along with fat in males. This emphasizes a seldom articulated aspect of the CIM that all carbohydrates are not equal, and the CIM refers most particularly to so called high glycemic index carbohydrates which provoke the strongest insulin response. Despite the impact of overall carbohydrates being non-significant therefore these data provide support for the carbohydrate-insulin model, particularly in females.
Finally, the third macronutrient suggested to be linked to obesity is fat intake. Our data suggested that absolute fat supply was only positively linked to obesity rate in males, and relative fat supply was indeed correlated to obesity rates in both sexes, although it is much weaker than the relative sugar supply.
This sex difference in the roles of the different macronutrients is an intriguing and potentially important observation, because previous suggestions regarding links of macronutrient intakes to obesity have not suggested that the impacts would depend on sex. Our data suggest the carbohydrate-insulin model and impacts of high GI carbohydrates may be much more important in females, while intake of fat may be a more important driver in males. Interestingly our previous work in mice which suggested fat was the key driver of adiposity was only performed in males.
The present study covers a wider range of countries from diverse social, economic and ethnic background so that provides a more comprehensive picture of how obesity prevalence correlates to food supply than previous studies. Nevertheless, it’s also doubted that malnutrition is an important confounder. After removing the low income countries data the association in non-low income countries still quite resembles that of the overall trend rather than the low income countries as our data shows, which emphasizes the existing of the association. However, the discrepancy between low income and non-low income groups is possibly due to the fact that malnutrition indeed plays an important role or a selection bias because of the relatively small sample size of low income countries.
Like numerous other ecological studies, although we have attempted to correct for confounding by including sex and poverty, the present study based on food supply data from the FAO has several limitations. The data are imperfect in many ways because they do not take account of food waste, and various other problems, such as inclusion of food fed to pets. Nevertheless, these problems would not be expected to differently affect the relationship between of food supply and obesity in the different sexes. The fact such relationships emerge despite the quality of the data suggests they may indeed be important patterns worth following up with more controlled feeding studies. If it is confirmed that males and females do indeed respond differently to different macronutrients this calls into question the one-size fits all approach to dietary formulations that has characterized the way we have tried to treat obesity thus far. The data here suggests that females may respond much more successfully to diets that cut out sugar, while males may be more responsive to diets curtailing fat consumption.
While the best way to understand the roles of different macronutrients on energy balance and obesity is undoubtedly to perform controlled randomized trials of people in residential facilities performing such studies for the protracted periods necessary to show significant effects is difficult. Studies of free-living subjects are plagued by the issues of misreporting intakes. So, while also for from perfect due to issues of not accounting for food wastage etc, food supply data at the level of the country provides an additional source of information by which these ideas may be evaluated. Previous studies have also used FAO supply data to explore the association of country level food supply composition and health parameters.
Conclusion
These data suggest both country level energy supplies in sugar and fat play important roles in obesity prevalence, but to different extents in males and females. In males both absolute fat and sugar energy supply were associated with obesity prevalence. However, in females only absolute sugar supply was significant. In both sexes relative fat and sugar energy supply (as a % of the overall energy) were significant predictors of obesity prevalence. Protein supply whether expressed as absolute or % of energy was unrelated to obesity prevalence in both sexes. Similarly, neither absolute nor relative total carbohydrate energy supply was associated with obesity prevalence in either sex. Absolute fat and sugar energy supply were significant predictors of the sex difference in obesity prevalence.
The contribution of different macronutrients intake to the global obesity prevalence has long been discussed and disputed. Intake of protein, carbohydrates and fats have all been blamed as the main drivers of the obesity epidemic. Our results do not support the idea of a protein target which drives over consumption of other macronutrients. Moreover, novel here is the discovery that obesity rate correlates to sugar and fat intake differentially between the sexes. Our findings suggest data on energy regulation should not be pooled across the sexes, and treatment options may be better targeted in a sex specific manner.
Acknowledgement
J.R.S. conceived the study, provided overall guideline and co-wrote the manuscript. C.N. collected and analyzed data, constructed figures and tables and co-wrote the manuscript. J.R.S. had primary responsibility for the final content. Both authors read and approved the final manuscript.
This work is funded by Shenzhen Key Laboratory of Metabolic Health (ZDSYS20210427152400001) to both authors. J.R.S. is also supported by the Chinese Academy of Sciences PIFI fellowship. C.N. is also supported by BTBU collaborative project (ZJ-2019-01).
| Unstandardized coefficients | R square | Adjusted R square | B | S.E | p | |
|---|---|---|---|---|---|---|
| Absolute Energy Supply Model | .662 | .658 | Fat energy supply (kcal/capita/day) | 0.017 | 0.002 | .000* |
| Sugar energy supply (Raw equivalent, kcal/capita/day) | 0.021 | 0.004 | .000* | |||
| Relative energy supply model | .557 | .551 | Fat energy supply (% of grand total energy supply) | 68.325 | 6.275 | .000* |
| Sugar energy supply (% of grand total energy supply) | 59.653 | 11.858 | .000* |
| Unstandardized coefficients | R square | Adjusted R square | B | S.E | p | |
|---|---|---|---|---|---|---|
| Absolute Energy Supply Model | .399 | .388 | Sugar energy supply (Raw equivalent, kcal/capita/day) | 0.042 | 0.006 | .000* |
| Relative energy supply model | .377 | .369 | Fat energy supply (% of grand total energy supply) | 27.707 | 8.354 | .001* |
| Sugar energy supply (% of grand total energy supply) | 121.133 | 15.788 | .000* |
| Unstandardized coefficients | R square | Adjusted R square | B | S.E | p | |
|---|---|---|---|---|---|---|
| Absolute Energy Supply Model | .344 | .336 | Sugar energy supply (Raw equivalent, kcal/capita/day) | 0.021 | 0.003 | .000* |
| Fat energy supply (kcal/capita/day) | -0.013 | 0.001 | .000* | |||
| Relative energy supply model | .322 | .314 | Carbohydrates energy supply (% of grand total energy supply) | 37.862 | 4.742 | .000* |
| Sugar energy supply (% of grand total energy supply) | 61.298 | 9.851 | .000* |
References
2. Hall KD, Heymsfield SB, Kemnitz JW, Klein S, Schoeller DA, Speakman JR. Energy balance and its components: implications for body weight regulation. Am J Clin Nutr. Apr 2012;95(4):989-994. doi:10.3945/ajcn.112.036350
3. Speakman JR, Elmquist JK. Obesity: an evolutionary context. Life Metab. Jul 26 2022;1(1):10-24. doi:10.1093/lifemeta/loac002
4. Haslam DW, James WPT. Obesity. Lancet. Oct 1 2005;366(9492):1197-1209. Doi 10.1016/S0140-6736(05)67483-1
5. Westerterp KR, Speakman JR. Physical activity energy expenditure has not declined since the 1980s and matches energy expenditures of wild mammals. International Journal of Obesity. Aug 2008;32(8):1256-1263. doi:10.1038/ijo.2008.74
6. Sabia S, Cogranne P, van Hees VT, et al. Physical Activity and Adiposity Markers at Older Ages: Accelerometer Vs Questionnaire Data. J Am Med Dir Assoc. May 1 2015;16(5)doi:ARTN 438.e7 10.1016/j.jamda.2015.01.086
7. Church TS, Thomas DM, Tudor-Locke C, et al. Trends over 5 Decades in US Occupation-Related Physical Activity and Their Associations with Obesity. Plos One. May 25 2011;6(5)doi:ARTN e19657 10.1371/journal.pone.0019657
8. Speakman JR, de Jong JMA, Sinha S, et al. Total daily energy expenditure has declined over the past three decades due to declining basal expenditure, not reduced activity expenditure. Nat Metab. Apr 2023;5(4):579-588. doi:10.1038/s42255-023-00782-2
9. Luke A, Dugas LR, Ebersole K, et al. Energy expenditure does not predict weight change in either Nigerian or African American women. Am J Clin Nutr. Jan 1 2009;89(1):169-176. doi:10.3945/ajcn.2008.26630
10. Tataranni PA, Harper IT, Snitker S, et al. Body weight gain in free-living Pima Indians:: effect of energy intake expenditure. International Journal of Obesity. Dec 2003;27(12):1578-1583. doi:10.1038/sj.ijo.0802469
11. 1Protsiv M, Ley C, Lankester J, Hastie T, Parsonnet J. Decreasing human body temperature in the United States since the industrial revolution. Elife. Jan 7 2020;9doi:ARTN e49555. 10.7554/eLife.49555
12. Bray GA, Paeratakul S, Popkin BM. Dietary fat and obesity: a review of animal, clinical and epidemiological studies. Physiology & Behavior. 2004/12/30/ 2004;83(4):549-555. doi:https://doi.org/10.1016/j.physbeh.2004.08.039
13. Simpson SJ, Raubenheimer D. Obesity: The protein leverage hypothesis. Review. Obesity Reviews. 2005;6(2):133-142. doi:10.1111/j.1467-789X.2005.00178.x
14. Hall KD. A review of the carbohydrate-insulin model of obesity (vol 71, pg 679, 2017). Eur J Clin Nutr. Jan 2018;72(1):183-183.
15. Ludwig DS, Ebbeling CB. The Carbohydrate-Insulin Model of Obesity Beyond “Calories In, Calories Out”. Jama Intern Med. Aug 2018;178(8):1098-1103. doi:10.1001/jamainternmed.2018.2933
16. Hu S, Wang L, Yang D, et al. Dietary Fat, but Not Protein or Carbohydrate, Regulates Energy Intake and Causes Adiposity in Mice. Cell Metabolism. 2018/09/04/ 2018;28(3):415-431.e4. doi:https://doi.org/10.1016/j.cmet.2018.06.010
17. Togo J, Hu S, Li M, Niu CQ, Speakman JR. Impact of dietary sucrose on adiposity and glucose homeostasis in C57BL/6J mice depends on mode of ingestion: liquid or solid. Molecular Metabolism. Sep 2019;27:22-32. doi:10.1016/j.molmet.2019.05.010
18. Solon-Biet SM, McMahon AC, Ballard JWO, et al. The Ratio of Macronutrients, Not Caloric Intake, Dictates Cardiometabolic Health, Aging, and Longevity in Ad Libitum-Fed Mice. Cell Metabolism. Mar 4 2014;19(3):418-430. doi:10.1016/j.cmet.2014.02.009
19. Finucane MM, Stevens GA, Cowan MJ, et al. National, regional, and global trends in body-mass index since 1980: systematic analysis of health examination surveys and epidemiological studies with 960 country-years and 9.1 million participants. Lancet. Feb 12 2011;377(9765):557-567. doi:10.1016/S0140-6736(10)62037-5
20. Staiano AE, Katzmarzyk PT. Ethnic and sex differences in body fat and visceral and subcutaneous adiposity in children and adolescents. International Journal of Obesity. Oct 2012;36(10):1261-1269. doi:10.1038/ijo.2012.95
21. Monteiro CA, Moura EC, Conde WL, Popkin BM. Socioeconomic status and obesity in adult populations of developing countries: a review. Review. Bull World Health Organ. Dec 2004;82(12):940-946.
22. Lieberman HR, Fulgoni VL, III, Agarwal S, Pasiakos SM, Berryman CE. Protein intake is more stable than carbohydrate or fat intake across various US demographic groups and international populations. The American Journal of Clinical Nutrition. 2020;doi:10.1093/ajcn/nqaa044
23. Samaha FF, Iqbal N, Seshadri P, et al. A Low-Carbohydrate as Compared with a Low-Fat Diet in Severe Obesity. New England Journal of Medicine. 2003;348(21):2074-2081. doi:10.1056/NEJMoa022637
24. Hall Kevin D, Bemis T, Brychta R, et al. Calorie for Calorie, Dietary Fat Restriction Results in More Body Fat Loss than Carbohydrate Restriction in People with Obesity. Cell Metabolism. 2015/09/01/ 2015;22(3):427-436. doi:https://doi.org/10.1016/j.cmet.2015.07.021
25. Ludwig DS, Friedman MI. Increasing Adiposity Consequence or Cause of Overeating? Jama-J Am Med Assoc. Jun 4 2014;311(21):2167-2168. doi:10.1001/jama.2014.4133
26. Taubes G. Good Calories Bad Calories. Alfred A.Knopf; 2007.
27. Westman EC, Feinman RD, Mavropoulos JC, et al. Low-carbohydrate nutrition and metabolism. The American Journal of Clinical Nutrition. 2007;86(2):276-284. doi:10.1093/ajcn/86.2.276
28. Teicholz N. The big fat surprise. Simon & Schuster; 2014.
29. Ludwig DS, Friedman MI. Increasing Adiposity: Consequence or Cause of Overeating? Jama. 2014;311(21):2167-2168. doi:10.1001/jama.2014.4133
30. Hall KD, Ayuketah A, Brychta R, et al. Ultra-Processed Diets Cause Excess Calorie Intake and Weight Gain: An Inpatient Randomized Controlled Trial of Ad Libitum Food Intake. Cell Metab. Jul 2 2019;30(1):226. doi:10.1016/j.cmet.2019.05.020
31. Dhurandhar NV, Schoeller D, Brown AW, et al. Energy balance measurement: when something is not better than nothing. Int J Obes (Lond). Jul 2015;39(7):1109-13. doi:10.1038/ijo.2014.199
32. Sasaki S, Horacsek M, Kesteloot H. An ecological study of the relationship between dietary fat intake and breast cancer mortality. Preventive medicine. Mar 1993;22(2):187-202. doi:10.1006/pmed.1993.1016
33. Senior AM, Nakagawa S, Raubenheimer D, Simpson SJ. Global associations between macronutrient supply and age-specific mortality. 2020;117(48):30824-30835. doi:10.1073/pnas.2015058117 %J Proceedings of the National Academy of Sciences
34. Moussavi N, Gavino V, Receveur O. Is obesity related to the type of dietary fatty acids? An ecological study. Public Health Nutr. Nov 2008;11(11):1149-55. doi:10.1017/S1368980007001541