

Vagus Nerve and Spleen Ablation’s Impact on Brown Adipose Tissue
Influence of vagus nerve and spleen ablation on brown adipose tissue histology of hypothalamic obese and non-obese male Wistar rats
Cassiane Lisbinski Nottari1, Vanessa Marieli Ceglaer2, Bruna Schumaker Siqueira3, Sandra Lucieni Balbo4, Pamela Rufina Stefanello5, Amanda Rocha Fujita6, Sabrina Grasselli7
- Postgraduate Program in Applied Health Sciences, Western Paraná State University, Brazil.
- Interdisciplinary Program in Biological Sciences-Physiology, Department of Psychology, Federal University of Rio Grande do Sul, Porto Alegre, Brazil.
- Postgraduate Program in Biochemistry and Molecular Biology, Federal University of Santa Maria, Brazil.
- Postgraduate Program in Health Sciences, University Parana State University, Brazil.
- Postgraduate Program in Health Sciences, University Parana State University, Brazil.
- Postgraduate Program in Health Sciences, University Parana State University, Brazil.
- Postgraduate Program in Health Sciences, University Parana State University, Brazil.
OPEN ACCESS
PUBLISHED: 30 November 2024
CITATION: NOTTAR, Cassiane Lisbinski et al. Influence of vagus nerve and spleen ablation on brown adipose tissue histology of hypothalamic obese and non-obese male Wistar rats. Medical Research Archives, [S.l.], v. 12, n. 11, nov. 2024. Available at: <https://esmed.org/MRA/mra/article/view/6009>.
COPYRIGHT: © 2025 European Society of Medicine. This is an open-access article distributed under the terms of the Creative Commons Attribution License, which permits unrestricted use, distribution, and reproduction in any medium, provided the original author and source are credited.
ISSN 2375-1924
ABSTRACT
Vagus nerve and spleen can influence metabolic function and adiposity. Brown adipose tissue is an organ specialized in thermogenesis, a biochemistry process of lipids degradation that results in heat production, elevating energy expenditure and contributing to anti-obesity effects.
Aim: Here, we evaluated the impact of vagus nerve and spleen absence on histology and lipid deposition of brown adipose tissue from non-obese and hypothalamic obese male Wistar rats.
Methods: Hypothalamic obesity was induced by neonatal glutamate L-monosodium (4g/Kg) administration during the first post-natal days. Control rats received equimolar saline. At 60 days of life, obese and control groups underwent surgery: vagotomy, splenectomy, and sham. At 150 days of life, the animals were weighed and measured. Blood was collected for biochemistry analysis of glucose and triglycerides, and insulin resistance evaluated. Moreover, white adipose tissue and brown adipose tissue depots were removed and weighed. Brown adipose tissue was histologically analyzed.
Results: In obese animals, elevated adiposity, hypertriglyceridemia, insulin resistance and higher lipid deposition in brown adipose tissue were noted. Vagus nerve ablation displayed more pronounced anti-adiposity effects, improving triglyceride plasma levels and insulin resistance in the obese rats compared to the control group. Moreover, spleen absence, especially in the obese group, raises nuclei number and reduced adipocyte size. These responses were amplified by vagus nerve ablation.
Conclusion: Hypothalamic obese rats show excessive adiposity and metabolic dysfunctions related to brown adipose tissue hypofunction. Vagus nerve and spleen absence reduced lipid deposition on brown adipose tissue of obese rats, suggesting reactivation of thermogenesis.
Introduction
Adipose tissue is a complex organ that modulates energy metabolism, regulates body weight, and exerts essential endocrine actions via adipokines¹. The white adipose tissue (WAT) and brown adipose tissue (BAT) are principal adipose tissue depots that directly impact health². Despite smaller quantities, the BAT depot can influence energy expenditure in humans and rodents, modulating lipids and carbohydrate homeostasis³. Obesity can affect the amount and activity of BAT, contributing to the installation of comorbidities such as diabetes and cardiovascular diseases⁴. It was reported that the amount and activity of BAT were 4-fold higher in lean individuals than overweight/obese individuals, suggesting BAT’s role in weight control. Moreover, the inverse relationship between BAT activity and body fatness suggests that BAT is protective against body fat accumulation due to its energy-dissipating activity⁵.
Lipid deposits determine the functional state and directly reflect innervation, thermogenesis activity, and the neuronal control of BAT³. Since the recent rediscovery of BAT in adult humans, this thermogenic tissue has attracted increasing interest, particularly in controlling energy metabolism⁶. In this regard, in health conditions, the intracellular lipid droplet (LD) accumulated in brown adipocytes present a multilocular deposition of little and numerous lipid droplets dispersed in the cytosol⁷. Moreover, active BAT shows higher mitochondria content, elevated nuclei number, and augmented presence of innervation and vascularization⁶. Thus, in health conditions, the brown adipocytes can quickly oxidize their fat inner stores and uptake circulating substrates to produce heat and raise metabolic rate, a process called thermogenesis⁸. In contrast, in an obesity state, the brown adipocytes show reduced thermogenic activity, restriction of lipolysis, and high lipids accumulation, typically characterized by bigger unilocular LD deposition in the BAT⁵.
Thermogenesis in BAT is possible due to the elevated expression of the tissue-specific uncoupling protein 1 (UCP1) found in the mitochondrial internal membrane⁸. The UCP1 protein effectively conducts thermogenesis by uncoupling substrate oxidation and adenosine triphosphate production through the proton leak⁹. In this respect, the fatty acids released from brown adipocyte lipolysis are thought to activate and fuel UCP1-mediated thermogenesis. Thus, BAT facilitates adaptive thermogenesis or the uncoupling of ATP production and substrate oxidation¹⁰.
The BAT thermogenic process is regulated by the sympathetic nervous system (SNS), which, via norepinephrine (NE) and the beta-adrenergic receptor, stimulates mitochondrial beta-oxidation, guaranteeing energy substrates to sustain the thermogenic process⁹. However, more recent data have indicated that the parasympathetic nervous system (PNS), particularly the vagus nerve (VN), could also modulate BAT activity and function¹¹. In addition, it is imperative to emphasize that SNS and SNP regulate BAT activity at multiple levels and are controlled in the nucleus of the solitary tract (NTS). It has been shown that NTS neurons receive and integrate metabolic signals from vagal afferents and regulate sympathetic output through relay circuits within the ventrolateral medulla¹².
The VN is an essential regulator of metabolism, and vagal nerve dysfunctions are intimately related to several diseases. In this regard, vagal hyperactivity is involved in hyperinsulinemia, insulin resistance (IR), and glucose intolerance in several obesity models¹³,¹⁴,¹⁵. Moreover, WAT content reduction and lipid homeostasis restoration are found in obese rodents and humans who have submitted to VN ablation (vagotomy)¹⁶,¹⁷. However, the role of VN in modulating the thermogenic process is unclear. Despite vagal fibers not directly innervating adipocytes in BAT, afferent vagal neurons can modulate SNS flux to BAT. In this point, Szekely M. showed that viscerosensory afferents, with axons in the VN, synapsing on second-order neurons in the NTS influence BAT activity¹⁸. Similarly, vagal afferents played a role in BAT thermogenesis in humans, showing that VN stimulation significantly increases
In rats, peripherally administered cholecystokinin (CCK) activates the SNS–BAT axis via the CCK receptor and vagal afferent nerves²⁰. Interestingly, vagal sensory neurons promote diet-induced thermogenesis (DIT) and may be an early protective mechanism against high-fat diet (HFD)-induced weight gain²¹. In agreement, ghrelin induces NE liberation in BAT, an event blocked by vagotomy²².
The VN also modulates inflammatory conditions, exerting an anti-inflammatory vagal reflex via splenic tissue and improving comorbidities associated with obesity and diabetes²³. The spleen is an essential immune and hematological organ whose activity can affect metabolism, including glucose and lipids homeostasis²⁴. Interesting splenic signals can influence BAT thermogenesis, through the potential to modulate UCP1 expression as well as brown adipocyte development²⁵. We hypothesize that VN and spleen tissues interact to modulate the BAT lipid deposition. Thus, in the present work, we evaluated the impact of vagotomy associated with splenectomy on BAT lipid deposition in non-obese and hypothalamic-obese male rats.
Material and methods
ANIMAL CARE
The present study used Wistar male rats, kept sob-controlled conditions de luminosity (12h dark/light) and temperature (23 ±2 ºC), and free access to water and food intake. The project was previously approved by Animal Ethical Commit (CEUA) of the State University of West Parana (UNIOESTE), Cascavel – Brazil, on 09/06/2017, respecting the Brazilian Animal Care Law established by the National Council for the Control of Animal Experimentation (CONCEA) and conforming to the principles and regulations of ARRIVES guidelines.
OBESITY HYPOTHALAMIC INDUCTION
Ten Wistar pregnant rats were allocated in the local bioterium of the Laboratory of Endocrine and Physiology and Metabolism (LAFEM) – Unioeste – Cascavel – Brazil until the offspring birth. At birth, the offspring size was adjusted to 6 – 8 pups per dam to guarantee adequate milk ingestion. Only male pups were maintained to avoid hormonal female influences. Twenty-four male pups were randomly selected and received 2nd to 6th post-natal days subcutaneous injections of monosodium glutamate (MSG) in a diary dose of 4g/Kg of body weight (BW) according to originally proposed by Onley (1969)²⁶ with adaptations. MSG-treated rats originated in the M-obese group. During the same period and via non-obese or Control (CTL; n= 24 rats), rats received saline (NaCl) hypersomolar solution at a 1.25g/Kg/BW dose. The CTL and M-obese rats were weaned at 21 days of life and distributed in cages (n=3 – 4 rats/cages) and received water and rodent chow (Biobase; Santa Catarina; Brazil) ad libitum, being maintained sob-controlled conditions de luminosity (12h dark/light) and temperature (23 ±2 ºC) until 60 days of life.
VAGUS NERVE AND SPLENIC ABLATION
At 60 days of life and after 12 hours of fasting, rats of CTL and M-obese groups were randomly selected for surgical procedures as described below. The subdiaphragmatic vagotomy (vag) was performed according to the protocol adapted by Balbo et al.¹³. Briefly, the animals in the previous fasting (12 hours) were anesthetized with isoflurane (1%), under oxygen at 1 mL/min in a mask and spontaneous ventilation. Next, the abdominal wall was laparotomized, and the liver and stomach separated to facilitate access to the VN in the esophagus wall. Thus, VN was isolated and cut. The spleen ablation, splenectomy (spl), was performed according to the protocol established by Gotoh et al.²⁷. Briefly, after anesthesia and abdominal laparotomy, the spleen was located, the blood vessels tied, and the organ was excised. In the groups Vag plus spl, both surgeries were simultaneously performed. Sham-operated rats were used as surgical control. After surgeries, the skin and muscle were sutured, and animals were transferred to individual cages receiving water and rodent chow ad libitum for seven days. Thus,Considering obesity and surgeries procedures originated eight experimental groups (10 rats/group):
CTL-sham: non-obese sham-operated;
CTL-vag: non-obese submitted at subdiaphragmatic vagotomy;
CTL-spl: non-obese splenectomized;
CTL-vag+spl: non-obese submitted at subdiaphragmatic vagotomy and splenectomized;
M-sham: obese sham-operated;
M-vag: obese submitted at subdiaphragmatic vagotomy;
M-spl: obese splenectomized and M-vag+spl: obese submitted at subdiaphragmatic vagotomy and splenectomized.
After seven post-surgical days, the animals were regrouped (3 rats/cages) and received water and food intake ad libitum.
BIOMETRIC, ADIPOSITY, AND METABOLIC PARAMETERS
At 150 days of life and after 12h of fasting, the rats had body weight (BW; g) registered as being next desensitized with CO₂. Immediately, the naso-anal length (NAL; cm) was measured, and the animals decapitated. Blood samples were collected and the plasma was separated for glucose, triglycerides, and insulin dosage. Glucose was measured using a colorimetric kit and insulin by radioimmunoassay technical. Insulin resistance was evaluated by triglycerides – glucose index (TyG), an alternative biomarker of IR, according to Simental-Mendía et al.²⁸. For this, fasting values of glucose and insulin were added to formulae: TyG index = ln [Fasting triglyceride (mg/dl) × fasting glucose (mg/dl)]/2. Obesity was evaluated by the Lee Index (LI), using the formulae √³(BW(g)) / NAL (cm), as proposed by Bernardis and Patterson (1968)²⁹. Moreover, the visceral WAT retroperitoneal (WAT-R) depot was removed and weighed to evaluate adiposity. The interscapular BAT was excised, cleaned, weighed, and transferred to a fixation solution (ALFAC) within 24 hours.
BROWN ADIPOSE TISSUE HISTOLOGICAL PROCEDURES AND ANALYSIS
Twenty-four hours after fixation, the BAT tissue samples (n=6 rats/group) were transferred to alcohol (70%) and submitted for histological procedures. Briefly, the samples were dehydrated in a growing alcohol solution (80 – 100%), diaphanized in xylol, and embedded in Paraplast (McCormickTM; Leica Microsystems Pty Ltd; Australia). Next, the tissue was sectioned at the microtome (Microsystems Inc., Wetzlar, Germany) to obtain 3–5 cuts of 7 μm-thick sections. Dewaxed sections are stained with hematoxylin and eosin (H&E) and photographed using an Olympus BX51 (Olympus Microscope, Shinjuku, Japan). Digital photographs were taken with a digital still 36-bit color camera, 1280×1024 pixels, with a DP71 Controller (Olympus). The ImageJ 1.42q software (National Institutes of Health [NIH], Bethesda, Md) is available from the NIH site (http://rsb.info.nih.gov/ij, accessed on January 18, 2019). For this, in each cut of BAT tissue was selected a quadrant of 20.0000 μm², and photomicrography was registered. Inside the quadrant was calculated the nuclei number and brown adipocyte size (μm²). Moreover, a qualitative description of the LD infiltration was done.
STATISTICAL ANALYSIS
The data are presented as mean ± standard error mean (SEM). All data were submitted to the Shapiro-Wilk normality test. For normally distributed data with homogeneous variances, Student t-tests were used to evaluate the effect of obesity, comparing CTL and M-obese rats. When variance heterogeneity was detected, Welch’s correction was applied. Non-normal data were compared using the Mann-Whitney U test. Surgeries effects were evaluated inside of each group non-obese (CTL) and M-sham using a two-way analysis of variance (ANOVA), obtaining factor (F) values: vag (V), spl (S), and interaction (I). When F was significant, the Tukey post-hoc test was applied. P<0.05 was adopted as the significant criterion in all statistical analyses.
Results
GROWTH, METABOLIC STATE, AND BAT HISTOLOGY IN MSG-HYPOTHALAMIC OBESE RATS
In adult life, M-sham rats presented lower BW (p<0.0001) and growth (p<0.0001), associated with
Higher WAT-R (p = 0.0229) content and LI values (p<0.0001) in comparison to CTL-sham (non-obese) group. Moreover, M-sham animals showed normoglycemia (p = 0.0166) associated with elevated levels of triglycerides (p = 0.0226), resulting in IR, as pointed out by higher TyG index (p = 0.0122) values compared to CTL-sham rats (Table 1).
Table 1. Biometric, adiposity and metabolic profile of hypothalamic obese versus control rats.
| CTL-sham | M-sham | p-value | |
|---|---|---|---|
| BW (g) | 417.11 ± 11.74 | 301.50 ± 14.29 | <0.0001 |
| NAL (cm) | 23.09 ± 0.13 | 19.44 ± 0.26 | <0.0001 |
| LI | 0.32 ± 0.01 | 0.34 ± 0.01 | <0.0001 |
| WAT-R (g/100gBW) | 0.98 ± 0.21 | 1.83 ± 0.35 | 0.0229ψ |
| Glucose (mg/dL) | 73.63 ± 4.19 | 72.63 ± 2.13 | 0.8346 |
| Triglycerides (mg/dL) | 128.05 ± 10.94 | 196.95 ± 24.14 | 0.0226$ |
| TyG index | 8.96 ± 0.12 | 9.61 ± 0.16 | 0.0122 |
Data are mean ± SEM (n = 8/10 rats/group). Student’s T test or Mann-Whitney (#), with or not Welch’s correction ($).
Abbreviations: BW: body weight; NAL: naso-anal length; LI: Lee index; WAT-R: white adipose tissue – retroperitoneal; TyG: triglycerides and glucose index.
The group M-sham showed increased BAT weight (Fig. 1a; p = 0.0422), associated with a reduction in nuclei number (Fig. 1b; p = 0.0149) and rises in brown adipocyte size (Fig. 1c; p = 0.0269) in comparison to BAT of CTL-sham rats. Representative photomicrographs of BAT in the CTL and M-sham groups are shown in Fig. 1d and 1e, respectively.
BAT from CTL-sham animals, it is possible to note elevated nuclei density (arrow), higher vascularization, and adipocytes numerous and small LD disperses at the cytosol (Fig. 1c; open circle). In contrast, reduced nuclei density (arrow) and elevated unilocular LD profile were seen in BAT from M-sham animals (Fig. 1e, white circle).
Figure 1. Comparative histology of brown adipose tissue of obese versus control rats.
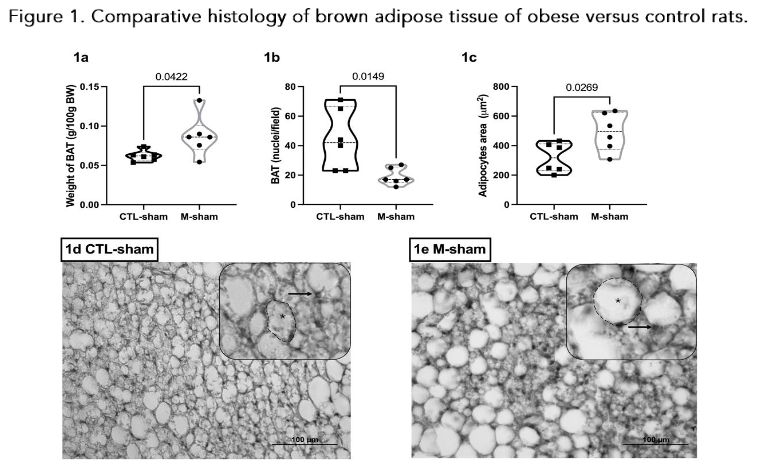
Data are mean ± SEM (n = 6 rats/group) of BAT weight (1a); nuclei (1b) and adipocytes area (1c). Representative BAT photomicrographs CTL (1d) and M-obese (1e), H&E stained showed in grayscale; 40× (magnification). Nuclei (→). Dashed circles show lipid depositions on adipocytes. Student’s t-test (p<0.05).
VAGUS AND SPLEEN ABLATION EFFECTS ON METABOLISM, ADIPOSITY, AND BROWN ADIPOSE TISSUE HISTOLOGY OF CONTROL RATS
As shown in the data from Table 2, in the CTL group, surgeries significantly decrease BW with V effect (F(1,20)= 41.51; p < 0.0001) and S effect (F(1,20)= 11.01; p = 0.0034). Moreover, in non-obese, VN ablation reduces adiposity, lipids, and IR. Thus, were found V effect on WAT-R content (F(1,32)= 12.52; p = 0.0013), triglycerides (F(1,20)= 13.21; p = 0.0010) and TyG index (F(1,20)= 4.929; p = 0.0381). Thus, CTL-vag and CTL-vag+spl groups showed smaller BW, WAT-R content, and triglyceride plasma values than CTL-sham (Table 2).
In contrast, V caused a slight increase in fasting values of glucose (F(1,20)= 20.72; < 0.0001) in the CTL group, with fasting plasma glucose levels being higher in CTL-vag+spl animals compared to CTL-sham and CTL-spl groups (Table 2).
In the CTL group, V affects BAT weight (F(1,20)= 8.713; p = 0.0079) having CTL-vag (p = 0.0381) and CTL-vag+spl (p = 0.0122) groups smaller BAT weight than CTL-spl rats (Figure 2a). Splenic ablation effect (F(1,20)= 6.928; p = 0.0160) and interaction (V versus S) effect (F(1,20)= 5.260; p = 0.0328) were noted on nuclei number of BAT from non-obese animals. Thus, BAT of CTL-spl rats had smaller nuclei numbers compared to CTL-sham (p = 0.0116) and CTL-vag (0.0312) groups (Figure 2b). Moreover, splenectomy (F(1,20)= 6.489; p = 0.0192) influences adipocyte size in BAT of CTL animals (Figure 2c) but without significant effect at post-test. Qualitative histological description confirms splenectomy effects in BAT of CTL animals as pointed out by F values. Thus, it is possible to note that BAT from CTL-spl rats shows a reduction in nuclei number and a rise in lipids infiltration compared to BAT of CTL-sham rats (Figure 2f and 2g). Also, it is possible to note changes in LD profile in BAT from the CTL-vag group with a more multilocular LD deposition in BAT than in CTL-sham animals.
Table 2: Biometric, adiposity, and metabolic parameters of non-obese (CTL) rats submitted to vagus nerve and spleen ablation.
| non-obese (CTL) | p-value | ||||
|---|---|---|---|---|---|
| sham | vag | spl | vag+spl | V | |
| BW (g) | 417.11 ± 11.74ᵃ | 344.00 ± 18.53ᵇ | 387.00 ± 8.09ᵃᵇ | 273.33 ± 9.0ᶜ | <0.0001 |
| WAT-R (g) | 0.98 ± 0.21ᵃ | 0.35 ± 0.06ᵇ | 0.55 ± 0.07ᵇ | 0.37 ± 0.14ᵇ | 0.0013 |
| Glucose (mg/dL) | 73.63 ± 4.19ᵃ | 94.74 ± 10.21ᵃᵇ | 72.97 ± 5.53ᵃ | 124.70 ± 11.42ᵇ | <0.0001 |
| Triglycerides (mg/dL) | 128.05 ± 10.95ᵃ | 94.24 ± 5.68ᵇ | 113.00 ± 2.89ᵇ | 81.00 ± 9.87ᵇ | 0.0010 |
| TyG index | 8.96 ± 0.12ᵃ | 8.15 ± 0.31ᵃ | 8.44 ± 0.21ᵃ | 8.04 ± 0.37ᵃ | 0.0381 |
Data are mean ± SEM (n = 6–8 rats/group). The p-value column shows the F effect in two-way ANOVA.
V: vagotomy; S: splenectomy; I: interaction.
Different letters above numbers show a significant effect with Tukey post-test (p < 0.05).
Abbreviations: BW: body weight; WAT-R: white adipose tissue – retroperitoneal; TyG: triglycerides and glucose index.
VAGUS NERVE AND SPLEEN ABLATION EFFECTS ON METABOLISM, ADIPOSITY, AND BROWN ADIPOSE TISSUE HISTOLOGY OF HYPOTHALAMIC-OBESE RATS
Data from Table 3 shows surgery effect in M group with V effect (F(1,28)= 4.243; p= 0.0488) significantly decrease BW and WAT-R content (F(1,27)= 12.52; p= 0.0013). The spleen absence also reduces adiposity in the MSG-obese group as indicated by the S effect in WAT-R (F(1,27)= 8.210; p= 0.0080) besides the I effect (F(1,27)= 8.043; p= 0.0086) potentiated this reduction. Thus, M-vag (p= 0.0005), M-spl (p= 0.0026), and M-vag+spl (p= 0.0005) groups showed smaller WAT-R content compared to M-sham animals. Glucose was slightly reduced by the S effect (F(1,36)= 6.095; p= 0.0184), without V effect (F(1,36)= 3.754; p= 0.0606). Therefore, the M-spl group presented smaller glucose fasting values (p= 0.0114) than M-vag rats. Triglycerides decreased with V effect (F(1,24)= 16.93; p= 0.0004) as well as TyG index (F(1,20)= 16.84; p= 0.0006) in M-obese rats. Thus, M-vag (p= 0.0191) and M-vag+spl (p= 0.0085) groups showed smaller triglyceride levels than M-spl rats. Moreover, M-vag (p= 0.0113) and M-vag+spl (p= 0.0041) presented smaller TyG values than M-sham.
Table 3: Biometric, adiposity and metabolic profile of hypothalamic obese rats submitted to vagotomy and splenectomy surgeries
| M-obese | p-value | ||||
|---|---|---|---|---|---|
| sham | vag | spl | vag+spl | V | |
| BW (g) | 301.50 ± 14.29ᵃ | 284.75 ± 8.36ᵇ | 294.50 ± 10.14ᵃᵇ | 273.50 ± 7.86ᵇ | 0.0488 |
| WAT-R (g) | 1.83 ± 0.35ᵃ | 1.38 ± 0.04ᵇ | 0.75 ± 0.06ᶜ | 0.82 ± 0.04ᵇᶜ | 0.0013 |
| Glucose (mg/dL) | 72.63 ± 2.13ᵃ | 75.55 ± 2.63ᵃᵇ | 64.73 ± 2.89ᵇ | 71.20 ± 2.61ᵃᵇ | 0.0606 |
| Triglycerides (mg/dL) | 196.90 ± 24.14ᵃ | 129.50 ± 14.49ᵇ | 238.10 ± 26.28ᵃ | 117.70 ± 11.47ᵇ | 0.0004 |
| TyG index | 9.61 ± 0.16ᵃ | 8.83 ± 0.09ᵇ | 9.25 ± 0.16ᵃᵇ | 8.72 ± 0.20ᵇ | 0.0006 |
Data are mean ± SEM (n= 6–8 rats/group). The p-value column shows the F effect in Two-way ANOVA.
V: vagotomy; S: splenectomy; I: interaction. Different letters above numbers show a significant effect with Tukey post-test (p<0.05).
Abbreviations: BW: body weight; WAT-R: white adipose tissue – retroperitoneal; TyG: triglycerides and glucose index.
The surgeries did not change BAT weight (Figure 3e) in the M-obese group, although nuclei numbers were influenced by V (F(1,20)= 8.456; p= 0.0087), S (F(1,20)= 19.15; p= 0.0003) and I (F(1,20)= 9.821; p= 0.0052) (Figure 3e). White brown adipocytes size was affected by S effect (F(1,20)= 4.795; p= 0.0406) (Figure 3g). In this sense, M-vag (p= 0.0019), M-spl (p= 0.0002), and M-vag+spl (p= 0.0003) groups showed higher nuclei numbers in comparison to M-sham rats. Moreover, the BAT of M-vag+spl animals showed a decreased (p= 0.0389) adipocyte size compared to M-sham. Qualitative histological analysis pointed to high nuclei number in BAT from M-vag, M-spl, and M-vag+spl rats compared to BAT of M-sham animals (Figure 3e-g) and reduced LD in M-vag+spl than M-sham (Figure 3d and 3g). In BAT from M-vag rats, it is also possible to note changes in the profile of LD deposition with more evident multilocular deposition compared to the M-sham group.
Figure 2. Histological changes induced by vagotomy and splenectomy surgeries in brown adipose tissue from control rats.
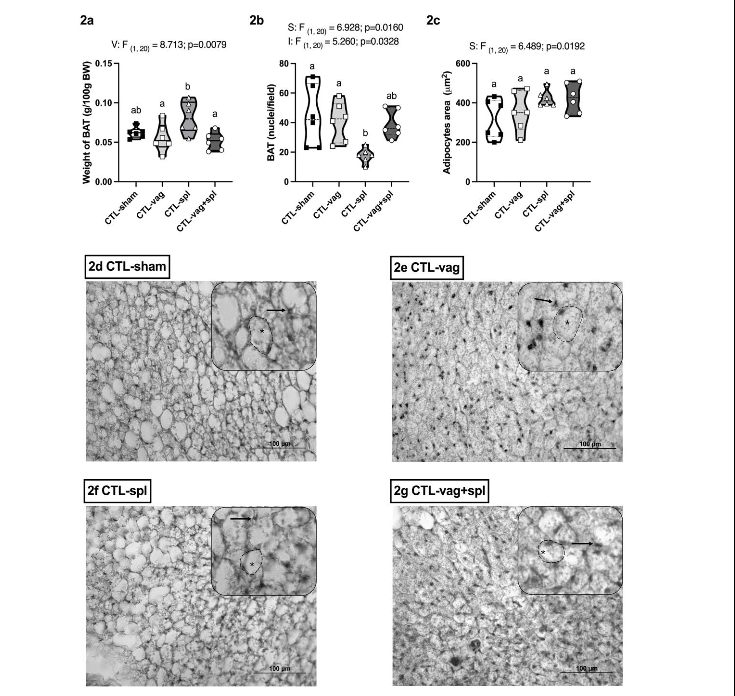
Data are mean±SEM (n=6 rats/group) of BAT weight (2a); nuclei (2b) and adipocytes area (2c). Two-way ANOVA (upper case) and Tukey post-test (lower case). Representative photomicrography of BAT, H&E stained (grayscale), 40x magnification (2d-g). nuclei (→), adipocytes (dashed line), and lipid droplets (*).
Figure 3. Histological changes induced by vagotomy and splenectomy surgeries in brown adipose tissue from hypothalamic obese rats
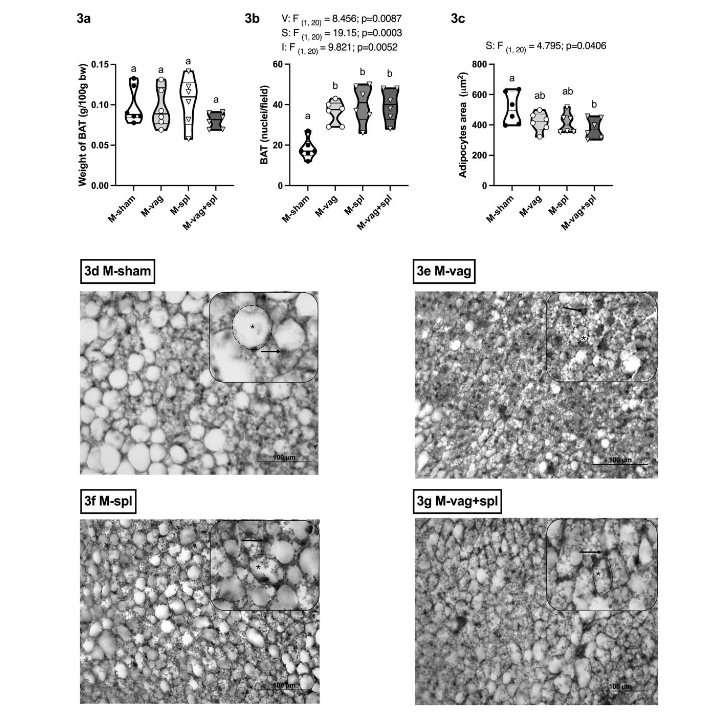
Data are mean±SEM (n=6 rats/group) of BAT weight (2a); nuclei (2b) and adipocytes area (2c). Two-way ANOVA (upper case) and Tukey post-test (lower case). Representative photomicrography of BAT, H&E stained (grayscale), 40x magnification (2d-g). nuclei (→), adipocytes (dashed line), and lipid droplets (*).
Discussion
A high dose of MSG administered on the first postnatal days induces obesity and metabolic abnormalities at long life³⁰, as confirmed at present work. Insulin is a primary lipogenic hormone, and hyperinsulinemia is central to adiposity in MSG hypothalamic obese rats³¹. Moreover, MSG-treated rats have hypothalamic lesions resulting in diminished growth hormone (GH) secretion³², event-related with smaller NAL and BW in these animals, as confirmed here.
It is imperative to note that M-hypothalamic obese animals have no hyperphagia but present lower resting metabolism, significantly influencing adiposity in this obese model. In this sense, BAT is an essential tissue for energy expenditure³³. BAT hypoactivity has been registered in M-obese rodents³⁴. Activated brown adipocytes dissipate energy, resulting in heat production. Thus, BAT burns fat and increases the metabolic rate, promoting a negative energy balance. For this metabolic profile, BAT activity can alleviate metabolic complications like dyslipidemia, IR, and type 2 diabetes³⁵.
The anti-obesity contribution of BAT thermogenesis has been well documented in several rodent obesity models²⁰,³⁵,³⁶. More recently, studies conducted with obese subjects also confirmed BAT hypofunction³⁷. Moreover, BAT reactivation at specific depots could increase energy expenditure, contributing to body weight control in human obesity³⁸.
Corroborating, we found increased BAT weight associated with higher lipid deposition in M-obese rats, suggesting a reduced thermogenesis process that could contribute to obesity installation in this obese model. In agreement, a recent study conducted by Martin et al.³⁹ showed that browning capacity in WAT tissues from MSG rats could represent a critical disability of this phenotype to dissipate excess energy in adipose tissue. BAT mass in the M-obese rat involves the development of relevant mitochondrial-dependent dysmetabolism.
In BAT mitochondrial GDP binding and oxygen consumption and lowered resting metabolic rate were found in M-obese mice at thermoneutrality conditions⁴¹. In contrast, increased norepinephrine turnover and normal thermogenesis were noted at cold exposition in M-obese mice²⁰,⁴².
Autonomic imbalance, with reduced sympathetic rate flux, is a typic characteristic of M-obese rodents. SNS densely innervates BAT, and sympathetic hypofunction can justify reduced thermogenesis activity in this obese model⁴³. In addition, insulin stimulates glucose and lipid uptake in brown adipocytes, favoring thermogenesis³⁸. As demonstrated here, M-obese rats present IR, an event that can contribute to higher BAT lipid deposition⁴⁴.
The ANS controls peripheral metabolism, including regulation of lipid storage and mobilization and thermogenesis in the white and brown adipose tissue. Obesity is defined by excessive WAT deposition, and higher WAT visceral depots are related to metabolic syndrome. Here, we noted that vagotomy reduced visceral WAT in non-obese and M-obese groups, but this effect was more accented in M-obese rats. Vagal hyperactivity is a common characteristic of M-treated animals³⁶. Hyperinsulinemia and high vagal activity are related to high WAT content in M-treated rats¹³. This event can explain the more significant effect of VN ablation in WAT from the M-obese rats, as seen in the present study.
Moreover, we noted that independent of obesity, VN ablation resulted in reduced body weight with loss of visceral WAT content, reduction of triglyceride plasma levels, and improved IR. These data confirm several studies that demonstrated vagotomy diminishes body weight and adiposity in healthy and obese states¹⁴,¹⁵,¹⁶,¹⁷. Recently, it was demonstrated that vagal afferent pathways drive negative feedback mechanisms relate d of airway dendritic cell function, with vagotomy enhancing plasma catecholamine levels⁴⁵.Thus, we suggested that VN ablation improves body weight profile, and IR rising catecholamine’s effects
Besides WAT expansion, the pro-inflammatory process is common in obesity⁴⁶. Immune organs, such as the spleen, show immunological dysfunction in obese conditions⁴⁷,⁴⁸. In the present study, we noted that splenectomy does not affect WAT content in non-obese, but in M-obese animals, the spleen and VN ablation provoked a reduction in WAT visceral depot, suggesting splenic participation in WAT mass regulation. This data confirms previous findings published by us and others on splenectomy modifying adiposity and metabolic state⁴⁹,⁵⁰,⁵¹.
Moreover, in non-obese animals, we noted that fasting glucose is modulated by VN ablation. Thus, in non-obese animals, the VN absence resulted in slight hyperglycemia, confirming the importance of vagal control on fasting glycemia, as recently reviewed by Thorens, 2024⁵².
Our data showed that VN ablation in M-obese and non-obese groups reduced BAT weight and lipid deposition, in agreement with the increased multilocular LD deposition found in BAT from vagotomized animals. It is well established that augmented SNS activity with high norepinephrine effects raises lipid beta-oxidation in BAT, resulting in a multilocular LD profile³⁵,³⁶. However, parasympathetic activity via VN may also modulate BAT function⁵³,⁵⁴, which appears to be required for energy expenditure.
Although VN does not directly innervate the brown adipocytes, afferent vagal signals to NTS appear important to BAT stimulus and vagal thermogenic effects⁵⁴. The electrical stimulation of the cervical part of the VN induces weight loss in rodents and humans whose effects are related to increased energy expenditure through BAT stimulation¹¹,⁶⁰. Moreover, many anti-diabetic and anti-obesity agents, including agonists for the glucagon-like peptide 1 (GLP1) receptor and cannabinoid 1 receptor (CB1), stimulate vagal afferent neurons⁵⁵. In agreement, Hibi et al.¹⁹ have shown that selective VN afferent interruption signals modulate BAT thermogenesis induced by HFD.
Interestingly, we also observed that spleen ablation modifies BAT histology, particularly in the M-obese group, a process accented by VN ablation. Thus, for the first time, we show that splenectomy associated with vagotomy can elevate BAT nuclei number and reduce adipocyte size in this tissue, suggesting BAT reactivation. We have demonstrated that during anemia state M-obese rats develop splenomegaly which is accompanied by reduction on BAT weight⁶¹, suggesting that splenic dysfunctions can result in lipolysis on BAT. In addition, the VN and spleen interactions are essential to the anti-inflammatory vagal reflex, and these neuro-immune circuits have been well-established to reduce the severity of several immunopathology diseases, such as diabetes and obesity⁵⁶. Afferent splenic nerves can modulate VN activity via the central nervous system. These neuronal circuits include the hypothalamic nucleus and NTS⁵⁷.
The M-obese animals present hypothalamic lesions²⁶, vagal hyperactivity, insulin resistance, sympathetic reduction⁴³, and spleen lymph disfunctions⁵⁷, conditions that might result in lowering BAT thermogenic process in this obese model. Insulin resistance decreases the expression of UCP1, suppressing the thermogenesis of BAT and impairing glucose uptake⁶². Thus, we suggested that VN and spleen ablation could reestablish neuro-immune circuits to M-obese by reducing adiposity and IR and reactivating BAT, corroborating with data showing a negative association between BAT activity and the amount of WAT⁵⁹.
Conclusion
In conclusion, the association between VN and spleen ablation attenuates obesity, dyslipidemia, and insulin resistance, exerting more positive effects of BAT in hypothalamic obese rats and indicating that the vagal and splenic neuroaxis are disrupted in the obesity state.
Financial Support:
Conselho Nacional de Desenvolvimento Científico e Tecnológico (CNPq) – Process number 4022320/2021
Disclosure
The authors report there are no conflicts of interest in this work.
Authors’ contributions:
Cassiane Lisbinski Nottari contributed to the conception, analysis, interpretation of data, and revisions. Vanessa Marieli Ceglaer contributed to experimental care, experimental procedures, data analyses, and revisions. Bruna Schumaker Siqueira contributed to animal care, experimental procedures, data analyses, and revisions. Sandra Lucieni Balbo performed the experiments. Pamela Rufina Stefanello contributed to experimental procedures. Amanda Rocha Fujita contributed to the analysis and interpretation of data and drafted the manuscript. Sabrina Grasselli supported the interpretation of all aspects of the work to ensure that questions related to the accuracy or integrity of any part of the work are appropriately investigated and resolved.
References
1. Prado WL do, Lofrano MC, Oyama LM, Dâmaso AR. Obesidade e adipocinas inflamatórias: implicações práticas para a prescrição de exercício. Rev Bras Med Esporte. 2009;15(5):378-383. doi:10.1590/S1517-8692200900060001
2. Corrêa, Heyn, Magalhaes. The Impact of the Adipose Organ Plasticity on Inflammation and Cancer Progression. Cells. 2019;8(7):662. doi:10.3390/cell s8070662
3. Fonseca-Alaniz MH, Takada J, Alonso-Vale MIC, Lima FB. The adipose tissue as a regulatory center of the metabolism. Arq Bras Endocrinol Metabol. 2006;50(2):216-229. doi:10.1590/s0004-27302006 000200008
4. Mariath AB, Grillo LP, Silva RO da, et al. Obesity and risk factors for the development of chronic non-transmissible diseases among consumers in a foodservice unit. Cad Saude Publica. 2007;23 (4):897-905. doi:10.1590/s0102-311×2007000400017
5. Worku MG, Seretew WS, Angaw DA, Tesema GA. Prevalence and Associated Factor of Brown Adipose Tissue: Systematic Review and Meta-Analysis. BioMed Res Int. 2020;2020:9106976. doi:10.115 5/2020/9106976
6. Boschini RP, Garcia Júnior JR. Regulação da expressão gênica das UCP2 e UCP3 pela restrição energética, jejum e exercício físico. Rev Nutr. 2005;18(6):753-764. doi:10.1590/S1415-52732005 000600006
7. Francine Naiara Broetto, Maria do Nascimento Brito. Tecido adiposo marrom e obesidade em humanos. Rev Saúde E Pesqui. 2012;5(1):121-135.
8. Porter C. Quantification of UCP1 function in human brown adipose tissue. Adipocyte. 2017;6 (2):167-174. doi:10.1080/21623945.2017.1319535
9. Adilson Domingos dos Reis Filho, Roberto Carlos Vieira Junior, Fabrício Azevedo Voltarelli. Exercicio fisico, proteina desacopladora-3 e termogenese. Rev Bras Prescrição E Fisiol Exerc. 2013;7(38):176-183.
10. Depieri TZ, Pinto RR, Catarin JK, de Carli MCL, Garcia Júnior JR. UCP-3: regulation of genic expression on skeletal muscle and possible role on body weight control. Arq Bras Endocrinol Metabol. 2004;48(3):337-344. doi:10.1590/s0004-27302004 000300003
11. Vijgen GHEJ, Bouvy ND, Leenen L, et al. Vagus nerve stimulation increases energy expenditure: relation to brown adipose tissue activity. PloS One. 2013;8(10):e77221. doi:10.1371/journal.pone.0077221
12. Liu C, Bookout AL, Lee S, Sun K, Jia L, Lee C, Udit S, Deng Y, Scherer PE, Mangelsdorf DJ, Gautron L, Elmquist JK. PPARγ in vagal neurons regulates high-fat diet induced thermogenesis. Cell Metab. 2014 Apr 1;19(4):722-30. doi: 10.1016/j.cmet.201 4.01.021. PMID: 24703703; PMCID: PMC4046333.
13. Lee HC, Curry DL, Stern JS. Direct effect of CNS on insulin hypersecretion in obese Zucker rats: involvement of vagus nerve. Am J Physiol. 1989 Mar;256(3 Pt 1):E439-44. doi: 10.1152/ajpendo.19 89.256.3.E439. PMID: 2646948.
14. Balbo SL, Grassiolli S, Ribeiro RA, Bonfleur ML, Gravena C, Brito Mdo N, Andreazzi AE, Mathias PC, Torrezan R. Fat storage is partially dependent on vagal activity and insulin secretion of hypothalamic obese rat. Endocrine. 2007 Apr;31(2):142-8. doi: 10.1007/s12020-007-0021-z. PMID: 17873325.
15. Barella LF, Miranda RA, Franco CC, Alves VS, Malta A, Ribeiro TA, Gravena C, Mathias PC, de Oliveira JC. Vagus nerve contributes to metabolic syndrome in high-fat diet-fed young and adult rats. Exp Physiol. 2015 Jan;100(1):57-68. doi: 10.1113/e xpphysiol.2014.082982. Epub 2014 Dec 18. PMID: 25398717.
16. Catinis AM, Hinojosa AJ, Leonardi C, Cook MW. Hepatic Vagotomy in Patients With Obesity Leads to Improvement of the Cholesterol to High-Density Lipoprotein Ratio. Obes Surg. 2023 Dec; 33(12):3740-3745. doi: 10.1007/s11695-023-0680 0-2. Epub 2023 Nov 4. PMID: 37924466.
17. Lubaczeuski C, Balbo SL, Ribeiro RA, et al (2015) Vagotomy ameliorates islet morphofunction and body metabolic homeostasis in MSG-obese rats. Brazilian Journal of Medical and Biological
Research 48:447–457. https://doi.org/10.1590/1414-431X20144340
18. Székely M. The vagus nerve in thermoregulation and energy metabolism. Auton Neurosci Basic Clin. 2000;85(1-3):26-38. doi:10.1016/S1566-0702(00)00217-4
19. Hibi M, Oishi S, Matsushita M, et al. Brown adipose tissue is involved in diet-induced thermogenesis and whole-body fat utilization in healthy humans. Int J Obes 2005. 2016;40(11): 1655-1661. doi:10.1038/ijo.2016.124
20. Yamazaki T, Morimoto-Kobayashi Y, Koizumi K, Takahashi C, Nakajima S, Kitao S, et al.. Secretion of a gastrointestinal hormone, cholecystokinin, by hop-derived bitter components activates sympathetic nerves in brown adipose tissue. J Nutr Biochem. (2019) 64:80–7. 10.1016/j.j nutbio.2018.10.009
21. Saito M, Matsushita M, Yoneshiro T, Okamatsu-Ogura Y. Brown Adipose Tissue, Diet-Induced Thermogenesis, and Thermogenic Food Ingredients: From Mice to Men. Front Endocrinol. 2020;11:222. doi:10.3389/fendo.2020.00222
22. Mano-Otagiri A, Iwasaki-Sekino A, Nemoto T, et al. Genetic suppression of ghrelin receptors activates brown adipocyte function and decreases fat storage in rats. Regul Pept. 2010;160(1-3):81-90. doi:10.1016/j.regpep.2009.11.010
23. Matteoli G, Gomez-Pinilla PJ, Nemethova A, et al. A distinct vagal anti-inflammatory pathway modulates intestinal muscularis resident macrophages independent of the spleen. Gut. 2014;63(6):938-948. doi:10.1136/gutjnl-2013-304676
24. Tarantino G, Scalera A, Finelli C. Liver-spleen axis: intersection between immunity, infections and metabolism. World J Gastroenterol. 2013;19(23): 3534-3542. doi:10.3748/wjg.v19.i23.3534
25. Knoll M, Winther S, Natarajan A, et al. SYK kinase mediates brown fat differentiation and activation. Nat Commun. 2017;8(1):2115. doi:10.1038/s41467-017-02162-3
26. Olney JW. Brain lesions, obesity, and other disturbances in mice treated with monosodium glutamate. Science. 1969;164(3880):719-721. doi:10.1126/science.164.3880.719
27. Gotoh K, Inoue M, Shiraishi K, et al. Spleen-derived interleukin-10 downregulates the severity of high-fat diet-induced non-alcoholic fatty pancreas disease. PloS One. 2012;7(12):e53154.
doi:10.1371/journal.pone.0053154
28. Simental-Mendía LE, Rodríguez-Morán M, Guerrero-Romero F (2008) The product of fasting glucose and triglycerides as surrogate for identifying insulin resistance in apparently healthy subjects. Metab Syndr Relat Disord 6:299–304. https://doi.org/10.1089/met.2008.0034
29. Bernardis LL, Patterson BD (1968) Correlation Between “Lee Index” And Carcass Fat Content In Weanling And Adult Female Rats With Hypothalamic Lesions. Journal of Endocrinology 40:527–528. https://doi.org/10.1677/joe.0.0400527
30. Konrad S, Farah V, Rodrigues B, et al. Monosodium glutamate neonatal treatment induces cardiovascular autonomic function changes in rodents. Clinics. 2012;67(10):1209-1214. doi:10.6061/clinic s/2012(10)14
31. Voltera AF, Cesaretti MLR, Ginoza M, Kohlmann O. Effects of neuroendocrine obesity induction on systemic hemodynamics and left ventricular function of normotensive rats. Arq Bras Endocrinol Metabol. 2008;52(1):47-54. doi:10.1590/s0004-27302008000100008
32. Corder R, Saudan P, Mazlan M, McLean C, Gaillard RC. Depletion of Hypothalamic Growth Hormone-Releasing Hormone by Neonatal Monosodium Glutamate Treatment Reveals an Inhibitory Effect of Betamethasone on Growth Hormone Secretion in Adult Rats. Neuroendocrinology. 1990;51(1):85-92. doi:10.1159/000125321
33. Nishimoto Y, Tamori Y. CIDE Family-Mediated Unique Lipid Droplet Morphology in White Adipose Tissue and Brown Adipose Tissue Determines the Adipocyte Energy Metabolism. J Atheroscler Thromb. 2017;24(10):989-998. doi:10.5551/jat.RV17011
34. Virtue S, Vidal-Puig A (2013) Assessment of brown adipose tissue function. Front Physiol 4:. https://doi.org/10.3389/fphys.2013.00128
35. Chait A, den Hartigh LJ. Adipose Tissue Distribution, Inflammation and Its Metabolic Consequences, Including Diabetes and Cardiovascular Disease. Front Cardiovasc Med. 2020;7:22.
doi:10.3389/fcvm.2020.00022
36. Brondani L de A, Assmann TS, Duarte GCK, Gross JL, Canani LH, Crispim D. The role of the uncoupling protein 1 (UCP1) on the development of obesity and type 2 diabetes mellitus. Arq Bras Endocrinol Metabol. 2012;56(4):215-225. doi:10.1590/S0004-27302012000400001
37. Vijgen GH, Bouvy ND, Teule GJ, Brans B, Schrauwen P, van Marken Lichtenbelt WD. Brown adipose tissue in morbidly obese subjects. PLoS One. 2011 Feb 24;6(2):e17247. doi: 10.1371/journal.pon e.0017247. PMID: 21390318; PMCID: PMC3044745.
38. Carpentier AC, Blondin DP, Virtanen KA, Richard D, Haman F, Turcotte ÉE. Brown Adipose Tissue Energy Metabolism in Humans. Front Endocrinol. 2018;9:447. doi:10.3389/fendo.2018.0 0447
39. Martín FM, Alzamendi A, Harnichar AE, et al (2023) Role of glucocorticoid receptor (GR) in white adipose tissue beiging. Life Sci 322:121681. https://doi.org/10.1016/j.lfs.2023.121681
40. Cypess AM, Kahn CR. The Role and Importance of Brown Adipose Tissue in Energy Homeostasis. Curr Opin Pediatr. 2010;22(4):478-484. doi:10.1097/MOP.0b013e32833a8d6e
41. Yoshioka K, Yoshida T, Kondo M. Reduced brown adipose tissue thermogenesis and metabolic rate in pre-obese mice treated with monosodium-L-glutamate. Endocrinol Jpn. 1991;38(1):75-79. doi:10.1507/endocrj1954.38.75
42. Yoshioka K, Yoshida T, Kondo M. Effect of acute cold-exposure on norepinephrine turnover and thermogenesis in brown adipose tissue and metabolic rate in MSG-induced obese mice. Jpn J Physiol. 1989;39(6):957-962. doi:10.2170/jjphysiol.39.957
43. Scomparin DX, Gomes RM, Grassiolli S, Rinaldi W, Martins AG, de Oliveira JC, Gravena C, de Freitas Mathias PC. Autonomic activity and glycemic homeostasis are maintained by precocious and low intensity training exercises in MSG-programmed obese mice. Endocrine. 2009 Dec;36 (3):510-7. doi: 10.1007/s12020-009-9263-2. Epub 2009 Oct 24. PMID: 19856134.
44. Maliszewska K, Kretowski A. Brown Adipose Tissue and Its Role in Insulin and Glucose Homeostasis. Int J Mol Sci. 2021;22(4):1530. doi:10.3390/ijms2 2041530
45. Trevizan-Baú, P. and McAllen, R.M. (2024), What is the Vagal–Adrenal Axis?. J Comp Neurol, 532: e25656. https://doi.org/10.1002/cne.25656
46. Kawai T, Autieri M V., Scalia R (2021) Adipose tissue inflammation and metabolic dysfunction in obesity. American Journal of Physiology-Cell Physiology 320:C375–C391. https://doi.org/10.1152/ajpcell.00379.2020
47. Buchan L, St. Aubin CR, Fisher AL, et al (2018) High-fat, high-sugar diet induces splenomegaly that is ameliorated with exercise and genistein treatment. BMC Res Notes 11:752. https://doi.org/10.1186/s13104-018-3862-z
48. Tarantino G, Citro V, Conforti P, et al (2019) Is There a Link between Basal Metabolic Rate, Spleen Volume and Hepatic Growth Factor Levels in Patients with Obesity-Related NAFLD? J Clin Med 8:1510. https://doi.org/10.3390/jcm8101510
49. de Souza TA, de Souza DW, Siqueira BS, et al (2020) Splenic participation in glycemic homeostasis in obese and non-obese male rats. Obes Res Clin Pract 14:479–486. https://doi.org/10.1016/j.orcp.2020.07.009
50. Leite N de C, Montes EG, Fisher SV, et al (2015) Splenectomy attenuates obesity and decreases insulin hypersecretion in hypothalamic obese rats. Metabolism 64:1122–1133. https://doi.org/10.1016/j.metabol.2015.05.003
51. Ai XM, Ho LC, Han LL, Lu JJ, Yue X, Yang NY. The role of splenectomy in lipid metabolism and atherosclerosis (AS). Lipids Health Dis. 2018 Aug 16;17(1):186. doi: 10.1186/s12944-018-0841-2. PMID: 30111317; PMCID: PMC6094557.
52. Thorens B. Neuronal glucose sensing mechanisms and circuits in the control of insulin and glucagon secretion. Physiol Rev. 2024 Oct 1;104 (4):1461-1486. doi: 10.1152/physrev.00038.2023. Epub 2024 Apr 25. PMID: 38661565.
53. Bartness TJ, Vaughan CH, Song CK. Sympathetic and sensory innervation of brown adipose tissue. Int J Obes. 2010;34(S1):S36-S42. doi:10.1038/ijo.2010.182
54. Madden CJ, Santos da Conceicao EP, Morrison SF. Vagal afferent activation decreases brown adipose tissue (BAT) sympathetic nerve activity and BAT thermogenesis. Temp Austin Tex. 2017; 4(1):89-96. doi:10.1080/23328940.2016.1257407
55. Anandhakrishnan A, Korbonits M. Glucagon-like peptide 1 in the pathophysiology and pharmacotherapy of clinical obesity. World J Diabetes. 2016;7(20):572-598. doi:10.4239/wjd.v7.i20.572
56. Bonaz B, Sinniger V, Pellissier S. Vagus Nerve Stimulation at the Interface of Brain-Gut Interactions. Cold Spring Harb Perspect Med. 2019 Aug 1;9(8): a034199. doi: 10.1101/cshperspect.a034199. PMID: 30201788; PMCID: PMC6671930.
57. Wei Y, Wang T, Liao L, et al (2022) Brain-spleen axis in health and diseases: A review and future perspective. Brain Res Bull 182:130–140. https://doi.org/10.1016/j.brainresbull.2022.02.008
58. Guareschi Z, Ceglarek V, Rodrigues P, Huning L, Festinalli C, Amorim, JP, Grassiolli S. (2019). Exercise and Vitamin D Supplementation Modify Spleen Morphology in Lean, but not, in Monosodium-Glutamate-Obese Rats. Journal of Spleen and Liver Research. 1. 1-14. 10.14302/issn.2578-2371.jslr-19-2819
59. Raiko J, Holstila M, Virtanen KA, et al (2015) Brown adipose tissue triglyceride content is associated with decreased insulin sensitivity, independently of age and obesity. Diabetes Obes Metab 17:516–519.
https://doi.org/10.1111/dom.12433
60. Laskiewicz J, Krolczyk G, Zurowski G, Sobocki J, Matyja A, et al. Effects of vagal neuromodulation and vagotomy on control of food intake and body weight in rats. J Physiol Pharmacol. 2003;54:603-610.
61. de Souza DW, Ceglarek VM, Siqueira BS, Volinski CZ, Nenevê JZ, Arruda JPA, Vettorazzi JF, Grassiolli S. Phenylhydrazine-induced anaemia reduces subcutaneous white and brown adipose tissues in hypothalamic obese rats. Exp Physiol. 2022;107(6):575-588. doi:10.1113/EP089883.
62. Wang J, Wu Q, Zhou Y, Yu L, Yu L, Deng Y, Tu C, Li W. The mechanisms underlying olanzapine-induced insulin resistance via the brown adipose tissue and the therapy in rats. Adipocyte. 2022; 11(1):84-98. doi:10.1080/21623945.2022.2026590