
Video Camera Analysis to Capture Muscle Specific Endurance
Main Article Content
Abstract
Previous studies have used an accelerometer to evaluate muscle endurance. This study compared endurance index values using a video phone to an accelerometer. Eleven healthy subjects (19-22yrs) were electrically stimulated for 5 minutes at 5 Hz on the hamstring muscles. Four 10s videos were captured at 1080p and 60fps (~283,000 pixels) with the phone. Videos were analyzed using sequential correlations (consecutive 1-2, or consecutive skipping an image 1–3) of the video images between the electrodes. The magnitude of the decrease in the correlation was used to indicate movement. A triaxial accelerometer measured the resultant vector of the movements and the decrease in acceleration was used to indicate fatigue. Analysis using 1-3 produced higher delta R2 values compared to 1-2 (0.038+0.004; 0.020+0.001). Endurance index was 72.1+19.4% for the accelerometer and 71.1+18.6% for the phone images, p=0.64. The mean difference between the methods was not different from zero and the 90% confidence interval was within 5%. In conclusion, the consecutive correlations method detected decreases in movement due to fatigue. The video method provided equivalent values to the previously established accelerometer method to measure muscle endurance. These results support the use of video to assess muscle acceleration during muscle specific endurance test.

1. Introduction
Muscle fatigue or weakness is a consequence, directly or indirectly, of many clinical diseases or injuries including muscular dystrophy, cancer, and neurological disorders1, 2. Impaired mitochondrial capacity is associated with muscle dysfunction and is directly or indirectly linked to a number of metabolic or muscular dystrophy conditions3-5. A number of different methods have been developed to evaluate skeletal muscle endurance6, 7.
An endurance test that utilizes twitch contractions has been previously developed to properly evaluate the fatigue of specific muscles in clinical populations8. The twitch endurance test uses neuromuscular electrical stimulation frequencies that vary from 2 to 6 Hz, and measures muscle activation as the acceleration associated with each contraction. The amount of acceleration remaining as a percentage of the initial highest acceleration has been called the endurance index. This approach has subsequently been used to evaluate skeletal muscle in a number of clinical populations2, 9, 10. In addition, the twitch endurance test has been applied to a number of different muscle groups11, 12. A key advantage of this approach is that it is noninvasive and requires only relatively inexpensive equipment: a neuromuscular stimulator capable of performing repeated twitch contractions and a tri-axial accelerometer with storage or Bluetooth capability.
While the twitch endurance index test is relatively simple, it does require a triaxial accelerometer that must be placed over the muscle of interest2. Removing the need for an accelerometer can reduce the cost and complexity of the data collection. In addition, placing an accelerometer over a muscle may not be practical if the muscle is small, such as muscles in the face, hands, or in a child. The purpose of this study was to test whether the muscle contractions of the endurance test could be accurately detected using a video camera. Given the universal adoption of video capable phones, we hypothesized that movement detected in the video cameras collected by a video capable phone would be equivalent to data collected by an accelerometer. Comparisons between endurance index measurements using a tri-axial accelerometer and a video capable phone were made on the hamstring muscles of young healthy subjects during a 5 minute endurance test using 5 Hz twitch stimulation frequencies.
2. Materials and Methods
2.1 Participants
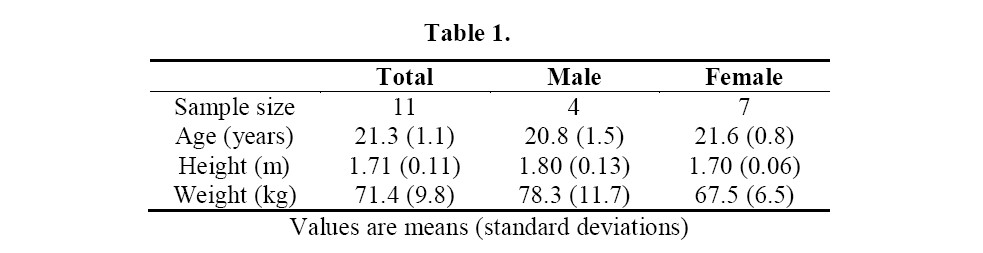
Eleven healthy individuals without known neurological or physical conditions and between the ages of 19 to 22 years old participated in this study (Table 1). This study was approved by the Institutional Review Board at the University of Georgia (VERSION00000153). All subjects were given written, informed consent prior to any testing.
2.2 Experimental Design
All subjects were tested on one occasion, with the accelerometer and the video capable phone being used simultaneously during the endurance test (5 minutes of twitch stimulation at 5 Hz).
Experimental setup: The participant was placed in a prone position. Two gel electrodes (5 x 10 cm) were placed on the hamstring muscle approximately 13 cm apart. The twitch electrical stimulator (Theratouch 4.7, Rich-Mar, USA) was set at 5Hz. A submaximal current sufficient to produce a visible high intensity muscle contraction without causing discomfort was used (51.8 + 11.7mA). Previous studies have shown that the endurance index is not influenced by the amount of current applied as long as a visible contraction occurs2.
The triaxial accelerometer was set at a frequency of 400Hz and measurement range of 2Gs. The device (WAX3, Axivity, UK) was placed just below the bottom of the superior electrode. The 5-minute muscle endurance test protocol was performed with continuous muscle stimulation set at the same current and frequency throughout the test. The data from the three axes were used to calculate a resultant vector (Figure 1). The resultant vector was analyzed using a Matlab routine to determine the maximal changes in acceleration at the beginning of the test and at the end of the test. The endurance index was calculated as the ending acceleration over the maximal acceleration times 100%.
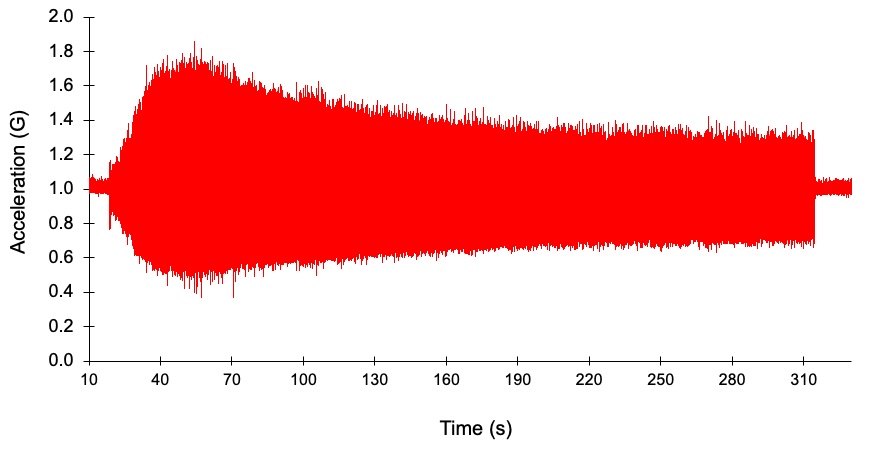
Figure 1. A representative example of the data collection by the accelerometer. Data are the resultant vector of acceleration in the x, y, and z directions.
A series of four, 10 second videos were captured at time points of 10, 20, 30s to obtain the maximal acceleration values, and at 290s to obtain the end acceleration value. The videos were taken using an iPhone X (Apple, Cupertino, CA) with settings of 1080p and 60fps. iPhone’s have built in gyroscopes and accelerometers to detect motion captured in these videos13. The iPhone was hand-held as steady as possible and captured the area of skin in which the picture was perpendicular to the hamstring muscle, and only showed about half of both electrodes (Figure 2a). A previous study (unpublished observations: Olivia Hooks) found that hand-held video provided results that were similar to results using a stereotaxically secured iPhone. The videos captured by the iPhone were analyzed with a Matlab code using sequential correlations of the individual frames (Figure 2b). Once the video was selected, the code prompted a box to be drawn on the image of the leg to indicate to the program which region to analyze. The analyzed region of each participant’s leg was similar by selecting the area between the electrodes with nothing in the box besides the skin. The correlations of the frames were either analyzed 1 to 2 or 1 to 3 meaning data indicating movement in the pixels was compared for frame 1 to frame 2 and then shifted to compare frame 2 to frame 3 or by looking at frame 1 and comparing it to frame 3 and then frame 2 to frame 4. The differences in frame analysis was used to determine the largest change in R2 values with twitch contractions. The data output of the code was the average of the 20 highest and 20 lowest R2 values for each video (out of 600 values over 10 seconds) and the difference between these R2 values.
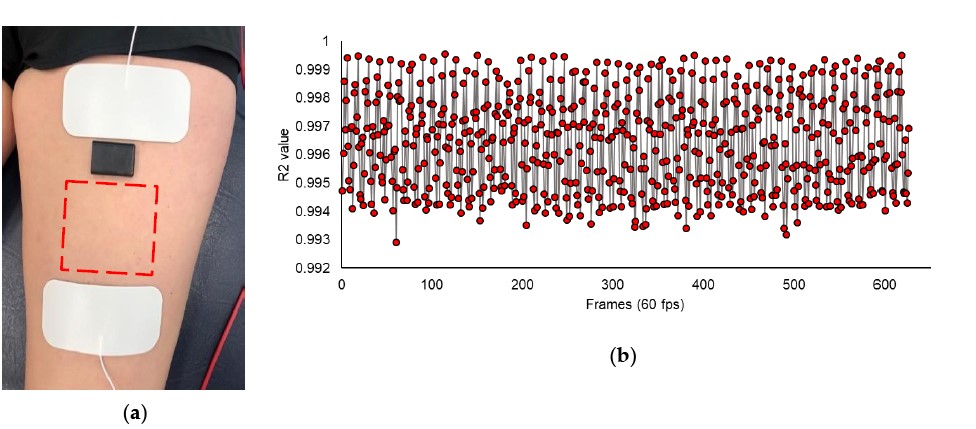
Figure 2. (a) The experimental arrangement for the endurance test. The stimulation electrodes are in white, the accelerometer is in black and placed just below the top electrode, the area imaged by the video phone is outlined in red. (b) Representative consecutive correlations during a 10 second video. The higher R2 values are during the relaxation between stimulations and the lower R2 values tend to be during the contraction.
An endurance index value was calculated from the R2 values in a similar fashion as the accelerometer in which the end value is compared to the peak value. The first three videos were taken within the forty seconds to capture the peak value for contraction speed. The video EI value was the end R2 value divided by the highest of the first three R2 values times 100%. These percentages were compared to the accelerometer EI values for both the 1 to 2 and 1 to 3 methods of analysis.
2.3 Data Analysis
Data analysis: Comparisons between the two video analysis approaches were made using t tests comparing the change in the R2 correlations between the two methods. Comparisons between the endurance index values calculated from the accelerometer and video were made using paired student t-tests for the mean values across subjects. Equivalency testing was also performed for the two methods of determining the endurance index 14. Data are reported as means + standard deviations. The accepted significance level was determined to be 0.05
3. Results
Subject Demographics. Participant demographics are shown in Table 1. Each subject was electrically stimulated on the hamstring muscle of either their right or left leg (Right: n = 6, Left: n = 5) at an intensity of 5 Hz and a current of 51.8 + 11.68mA.
The hamstring muscle showed evidence of fatigue as the decrease in the resultant vector (Figure 1). The video images had image sizes that varied from 81,795 to 429,087 pixels, average = 283,443. A representative image from the phone is shown in Figure 2. The movement from each contraction resulted in a decrease in the correlation between pixel intensities in consecutive images. This decrease was greater for the 1-3 correlations than the 1-2 correlations (Figure 3).
The endurance index for the hamstring muscle was 72.1 + 19.4% from the accelerometer and 71.1 + 18.6% from the video phone, p = 0.635. There was also no difference in the endurance index whether the analysis was 1-3 or 1-2, p = 0.182.
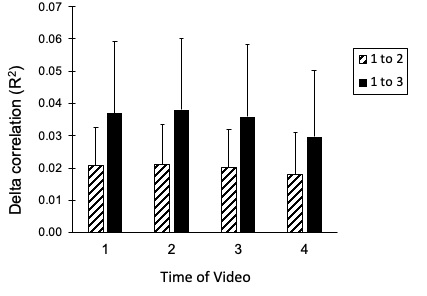
Figure 3. The delta R2 values for the four videos collected during the endurance tests. The values are the difference between the highest and lowest R2 values. The 1-3 analysis provided significantly higher delta R2 values and was used in subsequence comparisons to the accelerometer.
Equivalency testing for the video analysis compared to the accelerometer is shown in Figure 4. There was a good correlation between the two approaches, R2 = 0.87. The difference in the mean values between either 1-3 and 1-2 to the accelerometer was not significant (p = 0.635 and 0.147, respectively). The 95% confidence interval for individual data was within 6% of the average value for the 1-3, while it was just outside 6% for the 1-2 analysis.
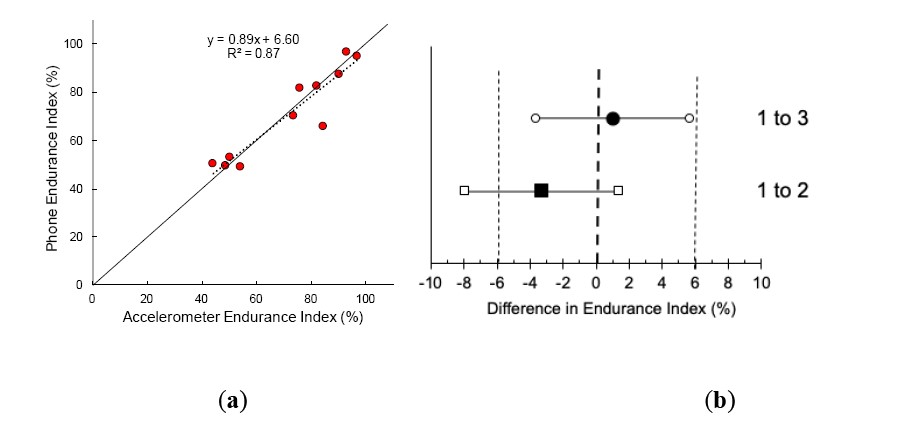
Figure 4. (a) The correlation between the accelerometer and the 1-3 video analysis. (b) The large solid symbols are the mean difference between accelerometer and video analyses. The open symbols are the 95% confidence intervals of the difference between the accelerometer and the video analyses. The thin vertical dotted lines are the plus and minus 6% values.
Equivalency testing for repeated testing of the endurance index is shown in Figure 4. The difference in the mean values between for the first and second groups was not significant (p = 0.187). The differences between the EI on the two testing days was not different for the First (p = 0.656) or second groups (p = 0.994). The 95% confidence interval for individual data was within 5% of the average value for the second group, while it was outside 5% for the first group.
4. Discussion
This study found that video capture of movement could be used when performing a muscle specific endurance test. There were no differences between endurance index values when collected by the video phone compared to acceleration collected with a triaxial accelerometer. The use of a triaxial accelerometer to measure muscle contraction is well established15, 16. In addition, triaxial accelerometers have been used specifically in a twitch contraction-based endurance test2, 10. The use of a video phone has several advantages over using an accelerometer. It does not require placing the device on the muscle of interest, which could influence the movement of the muscles. For example, it might allow the evaluation of muscle endurance in smaller muscles where the size of the accelerometer might be too big. It also reduces the amount of equipment necessary to perform the test, as having an electronic device (which almost always has video capability) is already necessary to control the accelerometer if it is used. Thus having a muscle specific test of endurance that only requires an inexpensive electrical stimulation device and an almost universal video camera has the potential to expand the use of the endurance test method.
The fatigue values found in this paper were similar to previous studies. The endurance index found in this study (~71%) was similar to that seen in a previous study of people without prior knee injuries(74%) 9.
This suggests that the use of video images can provide data that can be compared to previous studies using accelerometers. The hamstring was chosen as a large muscle that was suitable for video analysis and simultaneous accelerometer recordings. But at the same time the hamstring muscle group has shown endurance index values that were not too close to 100% as has been found for the calf and quadriceps muscles11, 12.
This study analyzed movement in video images by using consecutive correlations. This approach is relatively unique as there are few papers that have proposed a similar approach to studying movement17. The consecutive correlation method is similar to the auto correlation method used for laser Doppler blood flow18, 19. The difference is that instead of measuring a continuous movement condition, in this study the movement varied with each muscle contraction. So instead of performing multiple correlations over time and determining an extinction coefficient, pairwise correlations were made. Movement resulted in decreasing the correlation of consecutive images. With a sampling rate of 60 Hz, we found that greater reductions in the correlation were seen with consecutive correlations using 1-3 images (separation of 33.3ms) rather than 1-2 images (separation of 16.7ms). Different video sampling rates or different speeds of muscle contractions may change the optimal timing for consecutive correlation analysis.
A limitation of the video phone method for detecting muscle movement is the relatively low sampling rate20. The phone had a sample frequency of 60 Hz while the accelerometer method typically used sampling rates of 200-400 Hz8. To overcome the low sampling rate, we chose to analyze the lowest 20 R2 values and the highest 20 R2 values in each 10 second video clip (600 total frames). Another potential limitation of this study was the use of submaximal stimulation intensities. However, a previous study showed that the endurance index was not influenced by differences in stimulation intensity, and the purpose of our study was to make simultaneous measurements such that the movement caused by the stimulations was the same for the accelerometer and the video phone. Despite these limitations, future studies could use this method to measure muscle endurance in other muscles and without the need for accelerometer, potentially simplifying the data collection process.
A potential advantage of the video method is that it might be possible to study muscles that are either too small or otherwise can’t be covered with an accelerometer. An example of small muscles that might be studied with video are the extraocular muscles, which control eye movement. There have been two studies done to assess extraocular muscle fatigue, but these studies both used an animal model, and more indirect markers of fatigue such as creatine kinase activity and lactate build-up21, 22. With the use of the new phone method of measuring muscle endurance found in this study, the fatigue of extraocular muscles can be assessed in an easier and noninvasive way. In order to study smaller muscles, future studies will need to evaluate the minimum pixel numbers that can be analyzed while still providing adequate results.
In addition to testing different and potentially smaller muscles, the use of a video based endurance test has clinical implications. Reducing the equipment necessary to perform the test may make it an even more practical diagnostic and rehabilitation tool. Many diagnostic tests and rehabilitation techniques for muscle diseases and injuries can be very expensive and time consuming. For the diagnosis of some inflammatory myopathies, skeletal muscle biopsies, MRIs, and EMGs are essential but can be invasive and costly23. Additionally, many muscle injuries require repeat MRIs to both diagnose, assess progression, and guide return to play24. Therefore, the development of this smartphone muscle endurance test will allow for start to finish testing in a matter of minutes, requires minimal equipment, is noninvasive, and reports an EI value, which can be useful for evaluating the improvement or decline of muscle fatigue.
5. Conclusions
The results from this study suggest that the phone method for measuring muscle endurance works and the test does not require the accelerometer. Additionally, the 1-3 method was determined to be superior to the 1-2 method, although future studies will need to determine the optimal analysis rate for that study. Future studies can to be done in order to adjust the optimal parameters of the test along with testing different muscles and participants with various injuries or diseases now that it is determined this novel method is successful.
Funding: This research received no external funding
Acknowledgments:
Conflicts of Interest: Kevin McCully is the President of Infrared Rx, Inc,
Article Details
The Medical Research Archives grants authors the right to publish and reproduce the unrevised contribution in whole or in part at any time and in any form for any scholarly non-commercial purpose with the condition that all publications of the contribution include a full citation to the journal as published by the Medical Research Archives.
References
2. Willingham TB, Backus D, McCully KK. Muscle Dysfunction and Walking Impairment in Women with Multiple Sclerosis. Int J MS Care. Nov-Dec 2019;21(6):249-256. doi:10.7224/1537-2073.2018-020
3. Mitchell T, Chacko B, Ballinger SW, Bailey SM, Zhang J, Darley-Usmar V. Convergent mechanisms for dysregulation of mitochondrial quality control in metabolic disease: implications for mitochondrial therapeutics. Biochem Soc Trans. Feb 1 2013;41(1):127-33. doi:10.1042/BST20120231
4. Mitchell T, Darley-Usmar V. Metabolic syndrome and mitochondrial dysfunction: insights from preclinical studies with a mitochondrially targeted antioxidant. Free radical biology & medicine. Mar 1 2012;52(5):838-40. doi:10.1016/j.freeradbiomed.2011.12.014
5. Kendall FD. Mitochondrial disorders: Overview of diagnostic tools and new diagnostic trends. Journal of Pediatric Biochemistry. 2012 2012;2(4):193-203.
6. Kluger BM, Krupp LB, Enoka RM. Fatigue and fatigability in neurologic illnesses: proposal for a unified taxonomy. Neurology. Jan 22 2013;80(4):409-16. doi:10.1212/WNL.0b013e31827f07be
7. Al-Mulla MR, Sepulveda F, Colley M. A review of non-invasive techniques to detect and predict localised muscle fatigue. Sensors (Basel). 2011;11(4):3545-94. doi:10.3390/s110403545
8. Willingham TB, McCully KK. Assessment of Muscle Fatigue during Twitch Electrical Stimulation using Accelerometer-based Mechanomyography. Advances in Skeletal Muscle Function Assessment. August, 2017 2017;1(2):14-20.
9. Faxon JL, Sanni AA, McCully KK. Hamstrings muscle endurance in subjects with prior knee injuries. J Functional Morphology and Kinesiology. 2018;3(56):1-10. doi:10.3390/jfmk3040056
10. Bossie HM, Willingham TB, Schoick RAV, O'Connor PJ, McCully KK. Mitochondrial capacity, muscle endurance, and low energy in friedreich ataxia. Muscle Nerve. Oct 2017;56(4):773-779. doi:10.1002/mus.25524
11. McCully KK, Moraes C, Patel SV, M. G, Willingham TB. Muscle-specific endurance of the lower back erectors using electrical twitch mechanomyography. J Functional Morphology and Kinesiology. 2019;4(12):1-7. doi:10:3390/jfmk4010012
12. McCully KK, Prins P, Mistry K, Willingham TB. Muscle-specific endurance of the trapezius muscles using electrical twitch mechanomyography. Shoulder Elbow. Apr 2018;10(2):136-143. doi:10.1177/1758573217726269
13. Mourcou Q, Fleury A, Franco C, Klopcic F, Vuillerme N. Performance Evaluation of Smartphone Inertial Sensors Measurement for Range of Motion. Sensors (Basel). Sep 15 2015;15(9):23168-87. doi:10.3390/s150923168
14. Lakens D. Equivalence Tests: A Practical Primer for t Tests, Correlations, and Meta-Analyses. Soc Psychol Pers Sci. May 2017;8(4):355-362. doi:10.1177/1948550617697177
15. Barry DT, Hill T, Im D. Muscle fatigue measured with evoked muscle vibrations. Muscle Nerve. Mar 1992;15(3):303-9. doi:10.1002/mus.880150308
16. Gobbo M, Ce E, Diemont B, Esposito F, Orizio C. Torque and surface mechanomyogram parallel reduction during fatiguing stimulation in human muscles. Eur J Appl Physiol. May 2006;97(1):9-15. doi:10.1007/s00421-006-0134-8
17. Farnebäck G. Two-Frame Motion Estimation Based on Polynomial Expansion. vol 2749. 2003:363-370.
18. Yu G, Floyd TF, Durduran T, et al. Validation of diffuse correlation spectroscopy for muscle blood flow with concurrent arterial spin labeled perfusion MRI. Opt Express. Feb 5 2007;15(3):1064-75. doi:10.1364/oe.15.001064
19. Cheung C, Culver JP, Takahashi K, Greenberg JH, Yodh AG. In vivo cerebrovascular measurement combining diffuse near-infrared absorption and correlation spectroscopies. Phys Med Biol. Aug 2001;46(8):2053-65. doi:10.1088/0031-9155/46/8/302
20. Ashida G, Carr CE. Effect of sampling frequency on the measurement of phase-locked action potentials. Front Neurosci. 2010;4doi:10.3389/fnins.2010.00172
21. McMullen CA, Hayess K, Andrade FH. Fatigue resistance of rat extraocular muscles does not depend on creatine kinase activity. BMC Physiol. Aug 17 2005;5:12. doi:10.1186/1472-6793-5-12
22. Andrade FH, McMullen CA. Lactate is a metabolic substrate that sustains extraocular muscle function. Pflugers Arch. Apr 2006;452(1):102-8. doi:10.1007/s00424-005-0010-0
23. Schmidt J. Current Classification and Management of Inflammatory Myopathies. J Neuromuscul Dis. 2018;5(2):109-129. doi:10.3233/JND-180308
24. Vidoni A, Gillett M, Botchu R, James S. Lower limb muscle injuries: The good, the bad and the ugly. Eur J Radiol. Jul 2018;104:101-107. doi:10.1016/j.ejrad.2018.05.008