
Vision screening in school children from low-income areas of Sao Paulo city: Frequency and causes of visual impairment and blindness
Main Article Content
Abstract
Objective: The purpose of this study was to investigate frequency and causes of visual impairment in school-aged children from low-income areas of Sao Paulo evaluated by the “Ver na Escola” project, an initiative from São Paulo city government in partnership with a local non-governmental organization, launched aiming to offer free-of-charge visual screening and treatment to children enrolled in public schools.
Methods: Vision screening included presenting VA, ocular motility, and automated dynamic refraction assessment. Children referred for the ophthalmologist were submitted to automated and subjective static refraction, best-corrected VA, slit lamp, and fundus examination.
Results: A total of 17972 children were included in the study. Our findings show a frequency of visual impairment and blindness of 14.6% considering presenting VA decreasing to 1.3% after appropriate refractive correction. The main causes of visual impairment and blindness were uncorrected refractive errors (96.77%), amblyopia (0.88%), and retinal abnormalities (0.37%).
Conclusion: The frequency of visual impairment and blindness in the population under study was 14.6% mainly due to uncorrected refractive errors. These results support the need for expanded and perennial refractive services through school-based programs associated with provision of spectacles. These initiatives should be sustainable and pursued by health and school authorities to provision of screening and eye care for those in need.

1. INTRODUCTION
Vision screening programs have been historically used as an important tool of identifying and addressing visual deficits in target populations. School-based programs are useful as often provides the first indication of visual impairment or eye condition in children. 1 Traditionally, most programs rely on the first screening based on the visual acuity (VA) assessed by trained teachers, which has already been proved to be effective with good sensitivity and specificity on identifying visual impairment. 2,3 However, many children who are referred to further evaluation with an ophthalmologist often do not follow the recommendations due to a variety of factors as lack of communication, awareness, perceived importance, and conflict of commitments with scheduling. 4 In that sense, new models have been developed focusing not only on screening but also delivering the follow-up eye care through school, especially in low-income areas where access to eye care is limited. 5-7
Precise estimations on childhood prevalence of visual impairment and blindness are challenging due to the methodological difficulties from rare conditions studies. 8,9 The last ocular health publications by the World Health Organization showed blindness prevalence ranging from 0.3 to 1.5 cases per 1000 children in low and high income countries, respectively, resulting in estimations of 1.4 million blind children globally. 8,10 The main causes of childhood visual impairment and blindness are reported as uncorrected refractive errors and amblyopia, with notable differences on the underlying conditions across the globe, with higher frequency of congenital cataract and infectious diseases in low-income countries and retinopathy of prematurity in high-income countries. 11
From the moment of birth, vision is critical to child development. Cognitive and social abilities, coordination, balance and motor skills growth are facilitated by visual recognition and response to parents, family members, and caregivers. 12 Vision is the main tool to access and retain educational materials in a way that school-age children with vision impairment can experience lower levels of educational achievement when compared to their not visually impaired peers. 5, 13-15 Yet, vision is pivotal to strength social skills to develop self-esteem, friendships, and maintain well-being. 16 Early onset impairment may lead to delayed cognitive, motor, social and emotional development with lifelong consequences. 12
Recently, an initiative from the São Paulo city government in partnership with the local non-governmental organization Instituto Verter / H Olhos, the so called “Projeto Ver na Escola”, was launched aiming to offer free of charge visual screening to children enrolled in public schools of the city.
The purpose of this study was to investigate the frequency and causes of visual impairment and blindness in school-aged children from public schools of low-income areas of Sao Paulo city enrolled in “Projeto Ver na Escola”, Sao Paulo city, Brazil.
2. METHODS
From July 2018 to July 2019, our project took place in municipal educational institutions named Unified Educational Centers (CEUs). Currently, there are 45 CEUs distributed along the municipalities of Sao Paulo, with most of them located in the south and east regions. 22 CEUs were selected to the project according to their geographic location in order to guarantee that all the regions were covered by the project.
The project was financed by the Municipal Fund for Children and Adolescents, with a partnership agreement signed between the Secretariat of Social Development and Citizenship of Sao Paulo, Secretariat of Education and our Instituto Verter / H Olhos. Prior testing, the children guardians were asked for consent to participate in the current study by signing the consent form either sent through the children or during parents meetings in the school. Only children whose guardians authorized participation were included in this analysis. All the tests were performed in business days during the child school hours.
2.1. Screening tests
The project team was composed by one ophthalmic technologist and two ophthalmic assistants responsible for the visual screening, one ophthalmologist responsible for diagnosis and treatment of referred children, and one optician responsible for glasses provision. The project team was oriented to the study protocol and objectives, and trained in the exam techniques.
Vision screening tests included measurement of presenting distance visual acuity (PVA), meaning VA as measured with current glasses if they were used; ocular motility status assessed by cover test and versions; and automated refraction. The criteria to referral to ophthalmic exam performed by an ophthalmologist were: PVA worse than 20/32 in either eye, difference of two lines or more on the VA from right and left eyes, ocular motility showing tropia, and/or intermittent strabismus or nystagmus.
VA was tested by the ophthalmic technologist and assistants using a logMAR tumbling E chart at 4 meters, and at 2 meters for those failing to read the top line (<20/200). Testing for counting fingers, hand movement, and light perception was performed on those unable to read the top line at 1 meter. Each eye was measured separately with glasses if the participant presented with them or without them if the participant was not wearing any correction. VA was recorded as the smallest line read with one or no errors.
Participants were categorized according to the better seeing eye PVA as not visually impaired (PVA 20/32 or better); mild visual impairment (PVA worse than 20/32 to 20/63); moderate visual impairment (PVA worse than 20/63 to 20/200); severe visual impairment (PVA worse than 20/200 to 20/400) and blindness (PVA worse than 20/400). 17
Participants not visually impaired were sent back to the classroom and the parents were informed about the child’s visual status and the importance of re-testing in the next school-year.
2.2. Ophthalmological exam
Children referred for ophthalmological evaluation to cycloplegia received two drops of Mydriacyl eye drops (1%, tropicamide 10 mg/mL) with an interval of 5 minutes between them.
Automated and subjective static refraction, slit lamp examination, and indirect binocular fundus exam were performed in all referred participants. Slip lamp examination included eyelid, cornea, conjunctiva, iris and lens evaluation. After subjective cycloplegic refraction, the best-corrected visual acuity (BCVA) was noted for each eye and the participants were categorized according to the better seeing eye BCVA using the same criteria as PVA.
Eyes with PVA worse than 20/32 were assigned a principal cause of visual impairment/blindness by the examining ophthalmologist using a 6-item list. Refractive error was assigned as the cause for those eyes where distance visual acuity improved to 20/32 or better with refractive correction.
2.3. Statistical analysis
Statistical analyses were performed using Stata/SE Statistical Software, Release 14.0, 2015 (Stata Corp, College Station, Texas, USA). Data cleaning was conducted to verify potential inaccuracies. Frequency tables were used for descriptive analysis. Chi-Square test was used to compare frequencies among groups. Associations between outcomes and co-variables of interest were evaluated by multiple logistic regressions. P values ≤.05 were considered statistically significant.
3. RESULTS
A total of 17972 children (51.1% females) aged 8.24±3.54 (range: 3 to 17 years old) were included in the study. Other 970 children were excluded from the current report as parents/guardians authorize the eye examination but did not consent the data to be used for research purposes.
3.1. Vision Screening
Reliable VA measurement could not be performed in 716 (4.0%) individuals due to age or cognitive limitation. Mean PVA of the remaining 17256 children were 0.80±0.17 for both right and left eyes. Table 1 describes the distribution of PVA vision categories in the better-seeing eye from the 17256 subjects.
Table 1. Presenting visual acuity (VA) frequency and the respective 95% confidence interval (95% CI) in the better-seeing eye.
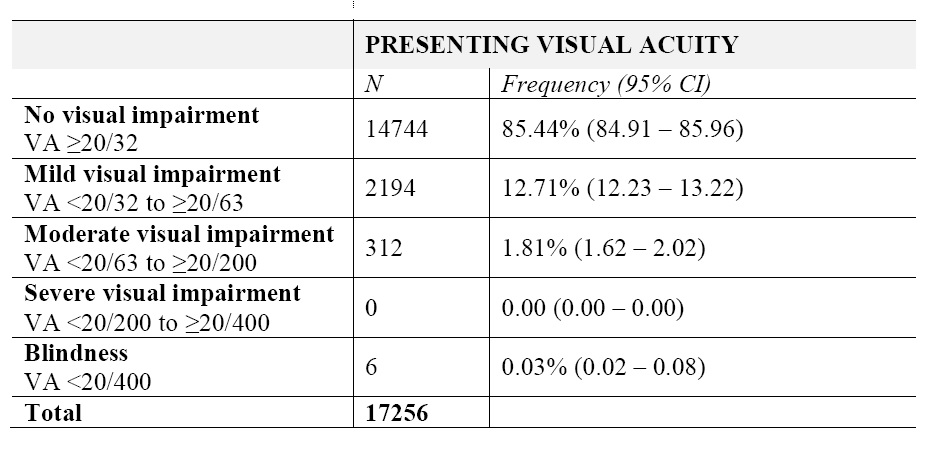 In general, 2512 (14.56%) participants were classified as visually impaired or blind. Multiple logistic regression showed a statistically significant association of female sex [odds ratio (OR)=1.21; 95% CI: 1.11 – 1.32; p<0.001) and older age (OR=1.06; 95% CI: 1.05 – 1.08; p<0.001) on increased frequency of visual impairment and blindness. Girls were 1.21 times more likely to be visually impaired when compared to boys. Figure 1 shows the frequency of participants with (PVA<20/32) or without (PVA≥20/32) visual impairment and blindness according to sex and age.
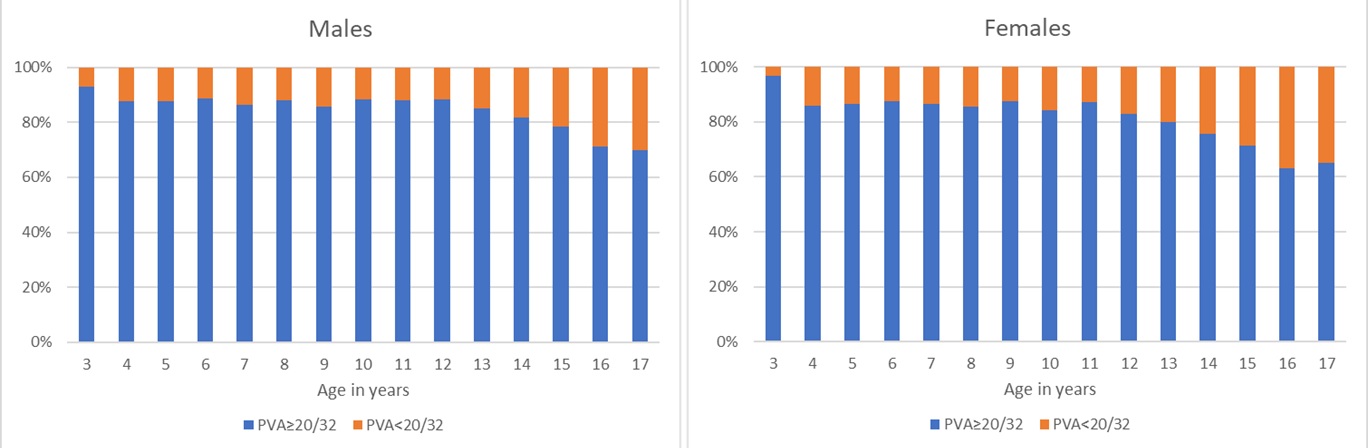
Figure 1. Frequency of participants with (PVA<20/32) or without (PVA≥20/32) visual impairment and blindness according to age.
According to the ophthalmologist referral criteria, 3645 (20.28%) were referred to ophthalmological examination with 3273 due to PVA<20/32 in either eye, 175 due to ocular motility disturbances, and 197 due to both reasons combined.
3.2. Ophthalmologist evaluation
Most of referred children were females (n=1986; 54.49%) and mean age was 8.93±3.74 (range 3 to 17 years old). Multiple logistic regression for referral showed that girls were more likely to be referred than boys (OR: 1.17; 95%CI: 1.08 -1.26; p<0.001) and the odds to be referred increased with age (OR: 1.07; 95%CI: 1.06 -1.08; p<0.001).
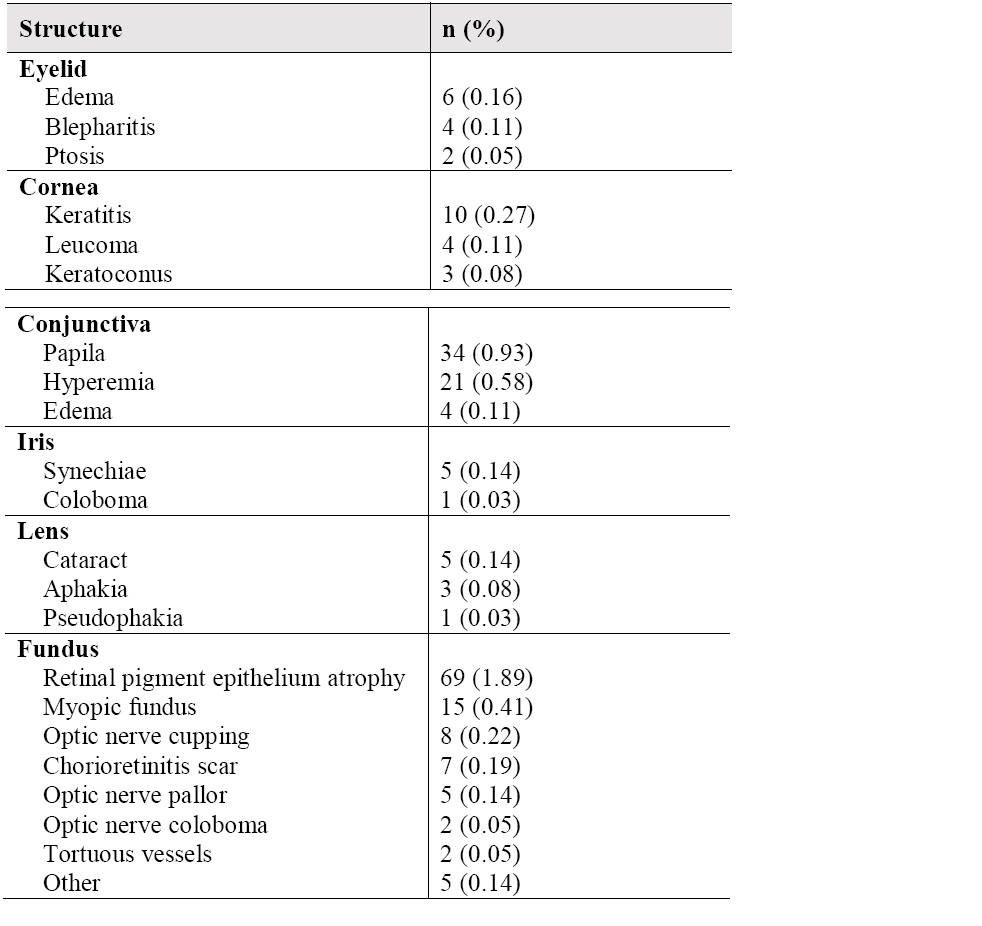
Slip lamp examination of eyelids, cornea, conjunctiva, iris, lens and fundus showed abnormalities in 12 (0.33%), 17 (0.47%), 40 (1.10%), 6 (0.16%), 9 (0.25%) and 98 (2.69%) participants, respectively. Table 2 shows the main clinical findings observed in the slip lamp examination according to its location.
Table 2. Clinical findings observed in the slip lamp examination according to the structure.
 Out of the total participants referred to the ophthalmic exam, 3264 (89.55%) were able to cooperate to subjective refraction and BCVA measurement.
3.3. Overall Visual Status and causes of visual impairment and blindness
Table 3 describes the distribution of vision categories in the better-seeing considering presenting and best-corrected visual acuities.
Table 3. Vision categories frequency and 95% confidence interval (95%CI) considering presenting and best-corrected visual acuities (VA).
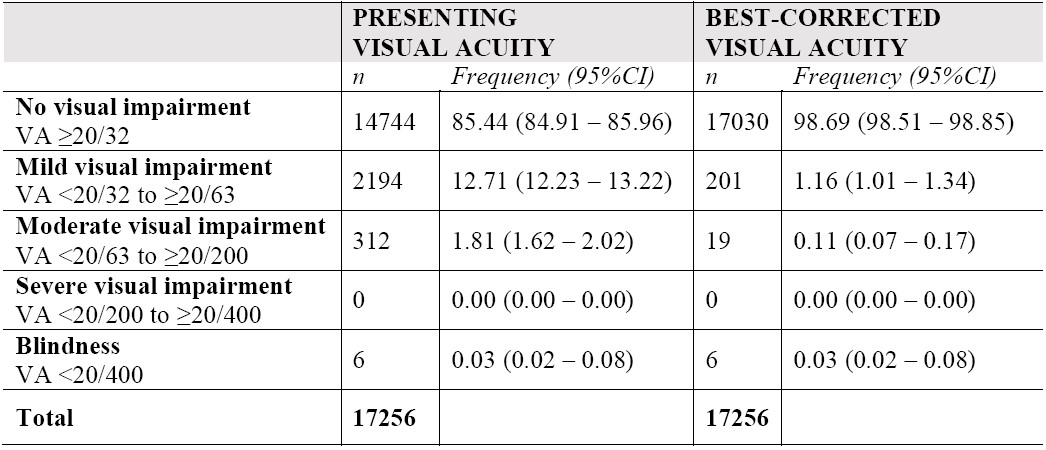
The comparison between PVA and BCVA shows a significant change in the vision categories distribution (p<0.001) showing that after refractive correction provision, 2286 children left vision impairment status, representing 91.0% (2286/2512) participants initially visually impaired.
At the end of the exam, the ophthalmologist assigned a principal cause of visual impairment for each eye. Table 4 shows the main causes of visual impairment in the participants’ eyes.
Table 4. Principal causes of visual impairment by eye (presenting visual acuity).
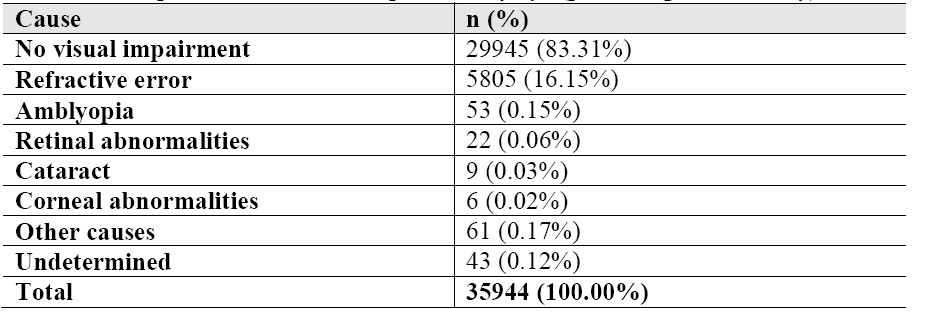
Considering only visually impaired eyes (n=5999), the main causes of impairment were uncorrected refractive errors (96.77%), amblyopia (0.88%), and retinal abnormalities (0.37%).
4. DISCUSSION
Our data shows the frequency and causes of visual impairment and blindness in a large population of visually screened school-aged children from low-income areas of Sao Paulo city, Brazil. Although the study included a substantial number of tested children, its main limitation is that the data were derived from a convenience sample. Population-based studies require a sampling method to select a group of individuals that are representative of the whole population. In cases of low frequent diseases as blindness in childhood, the sample size required for those studies is usually large, making them costly and time-consuming. Most of the studies on visual impairment and blindness are focused on population aged 50 years and older as more than 80% of vision impairment occurs in this age group, however, epidemiological studies are encouraged to include younger populations. Alternatively, there is a stimulus to child health surveys to include eye care information on their design. 11
The ophthalmological examination protocol used in the current study was similar to those from the Refractive Error in School Children (RESC) protocol which had been used in in the last two decades in several countries, including Brazil. 18-21 The frequency of visual impairment in our study was 14.55% considering PVA and decreased to 1.30% when considering BCVA. Previous population-based studies using the same visual impairment classification criteria, however, report a variety of prevalence ranging from 1.4% in South Africa (age range: 5-15) 22 to 12.2% in Vietnam (age range: 12-15) 23 for PVA and from 0.32% in South Africa (age range: 5-15) 22 to 1.40 in Malaysia (age range: 7-15) 24 for BCVA. As visual impairment and blindness are shown to be associated with age (OR=1,06; IC 95%: 1,05 – 1,08; p<0,001), the comparison among different studies may be interpreted with cautions taking the participants age into account.
Similarly to our results, a recent study on school-age Brazilian children (age range: 7-17) found a frequency of visual impairment and blindness of 14.58% considering PVA (no BCVA measurements were performed). 25 On the other hand, a previous population-based study (age range: 11-14) performed in Brazil found a prevalence of presenting and best-corrected visual acuity <20/32 in the better vision eye of 2.67%, and 0.41%, respectively. 21 When considering only those in the same age range (i.e. 11 to 14 years old), our study would still find higher PVA and BCVA frequencies of visual impairment and blindness of 16.25% and 0.93%, respectively. Regardless age, frequencies of disease in not population-based studies are expected to be higher as individuals not impaired are less likely to participate in surveys. 11,16
The higher frequency of visual impairment in girls when compared to boys may reflect the main causes of visual impairment and blindness in our sample. More than 95% of the visually impaired eyes were associated to refractive error and the literature shows a higher incidence of refractive disorders causing visual impairment in females when compared to males. 26, 27 On the same line, refractive errors potentially causing visual impairment are associated to increasing age and reflect the significant effect of age on visual impairment and blindness frequencies in our study. 11,27
Although the main causes of visual impairment and blindness in school-age children worldwide are uncorrected refractive errors and amblyopia, low- and middle-income countries reports usually showed a high frequency of corneal scarring and leukoma due to infection diseases and nutritional deficits. 11 In the past couple decades, however, these countries have been facing a shift in eye care priorities among child populations as result of successful public health initiatives. 28 In fact, in our sample, only four cases of corneal abnormalities were observed. Moreover, only seven eyes showed chorioretinitis scars due to infection processes and the main causes of visual impairment and blindness followed the world trend with uncorrected refractive errors and amblyopia as the leading causes.
Since 2008, there are policies in Brazil that state that children with disabilities should be educated alongside with their non-disabled peers. 29 According to the 2018 School Census, in 10 years the number of children with disabilities under inclusive education has increase 70% with more 1.2 million children enrolled in regular schools. 30 In that sense, selection bias are not expected to influence our estimates on visual impairment by sampling regular schools.
School-based vision screening programs are essential to appropriate childhood ocular health care. Although the teacher’s participation enhances the program success, there is a gap between the vision screening and the treatment offer. By providing the treatment in the school premises, initiatives as the “Projeto Ver na Escola” contribute to adequate delivery of eye care and to mitigate possible barriers related to lack of access. The current study shows treatable causes as the main causes of visual impairment in this population which reinforces the need of such programs in order to reduce the burden of the disease.
5. CONCLUSION
Our findings show a frequency of visual impairment and blindness of 14.6% considering presenting visual acuity decreasing to 1.3% after appropriate refractive correction. These results support the need for expanded and perennial refractive services through school-based programs associated with the provision of free-of-charge or affordable spectacles. Initiatives as the “Ver na Escola” should be sustainable and pursued by health and school authorities to provision of screening and eye care for those in need.
Conflict of interest: None of the authors have conflicts of interest to declare.
Financial support: Municipal Fund for Children and Adolescents Sao Paulo city.
Research Ethics approval: Hospital de Olhos Paulista #33814120.7.0000.9867
Article Details
The Medical Research Archives grants authors the right to publish and reproduce the unrevised contribution in whole or in part at any time and in any form for any scholarly non-commercial purpose with the condition that all publications of the contribution include a full citation to the journal as published by the Medical Research Archives.
References
2. Kaur G, Koshy J, Thomas S, Kapoor H, Zachariah JG, Bedi S. Vision Screening of School Children by Teachers as a Community Based Strategy to Address the Challenges of Childhood Blindness. J Clin Diagn Res. 2016;10(4):NC09-14.
3. Marmamula S, Khanna RC, Mettla AL, Pehere NK, Keeffe JE, Yameneni DK, et al. Agreement and diagnostic accuracy of vision screening in children by teachers, community eye-health workers and vision technicians. Clin Exp Optom. 2018;101(4):553-559.
4. Pizzi LT, Snitzer M, Amos T, Prioli KM, Steele D, Levin AV. Cost and effectiveness of an eye care adherence program for Philadelphia children with significant visual impairment. Popul Health Manag. 2015;18(3):223-31.
5. Ethan D, Basch CE, Platt R, Bogen E, Zybert P. Implementing and evaluating a school‐based program to improve childhood vision. J Sch Health. 2010;80(5):340-5.
6. Alvi RA, Justason L, Liotta C, Martinez-Helfman S, Dennis K, Croker SP, et al. The Eagles Eye Mobile: assessing its ability to deliver eye care in a high-risk community. J Pediatr Ophthalmol Strabismus. 2015;52(2):98-105.
7. Johnson C, Majzoub K, Lyons S, Martirosyan K, Tattersall P. Eyes that thrive in school: a program to support vision treatment plans at school. J Sch Health. 2016;86(5):391–6.
8. Gilbert C, Foster A. Childhood blindness in the context of VISION 2020: the right to sight. Bull World Health Organ. 2001;79(3):227-32.
9. Muhit M, Karim T, Islam J, Hardianto D, Muhiddin HS, Purwanta SA, et al. The epidemiology of childhood blindness and severe visual impairment in Indonesia. Br J Ophthalmol. 2018;102(11):1543-9.
10. World Health Organization. Preventing blindness in children, report of a WHO/IAPB scientific meeting. Geneva: World Health Organization; 2000; Report No: WHO/PBL/00.77.
11. World Health Organization. World report on vision. Geneva: World Health Organization. 2019; Licence: CC BY-NC-SA 3.0 IGO.
12. Warren DH. Blindness and children: an individual differences approach. 1994. Cambridge: University Press.
13. Chanfreau J, Cebulla A. Educational attainment of blind and partially sighted pupils. 2009; London: RNIB.
14. Toledo CC, Paiva AP, Camilo GB, Maior MR, Leite IC, Guerra MR. Early detection of visual impairment and its relation with school effectiveness. Revi Assoc Med Bras. 2010;56(4):415–9.
15. Augestad LB. Self-concept and self-esteem among children and young adults with visual impairment: A systematic review. Cogent Psychol. 2017;4:1.
16. Rainey L, Elsman EBM, van Nispen RMA, van Leeuwen LM, van Rens GHMB. Comprehending the impact of low vision on the lives of children and adolescents: a qualitative approach. Qual Life Res. 2016;25(10):2633–43.
17. GBD 2019 Blindness and Vision Impairment Collaborators; Vision Loss Expert Group of the Global Burden of Disease Study. Trends in prevalence of blindness and distance and near vision impairment over 30 years: an analysis for the Global Burden of Disease Study. Lancet Glob Health. 2020:S2214-109X(20)30425-3.
18. Maul E, Barroso S, Munoz SR, Sperduto RD, Ellwein LB. Refractive Error Study in Children: results from La Florida, Chile. Am J Ophthalmol. 2000;129(4):445–54.
19. Negrel AD, Maul E, Pokharel GP, Zhao J, Ellwein LB. Refractive error study in children: sampling and measurement methods for a multi-country survey. Am J Ophthalmol. 2000;129(4):421–6.
20. Murthy GV, Gupta SK, Ellwein LB, Muñoz SR, Pokharel GP, Sanga L, et al. Refractive error in children in an urban population in New Delhi. Invest Ophthalmol Vis Sci. 2002;43(3):623–31.
21. Salomão SR, Cinoto RW, Berezovsky A, Mendieta L, Nakanami CR, Lipener C, et al. Prevalence and causes of visual impairment in low-middle income school children in Sao Paulo, Brazil. Invest Ophthalmol Vis Sci. 2008;49(10):4308-13.
22. Naidoo KS, Raghunandan A, Mashige KP, Govender P, Holden BA, Pokharel GP, et al. Refractive error and visual impairment in African children in South Africa. Invest Ophthalmol Vis Sci 2003;44(9):3764-70.
23. Paudel P, Ramson P, Naduvilath T, Wilson D, Phuong HT, Ho SM, et al. Prevalence of vision impairment and refractive error in school children in Ba Ria - Vung Tau province, Vietnam. Clin Exp Ophthalmol. 2014;42(3):217-26.
24. Goh PP, Abqariyah Y, Pokharel GP, Ellwein LB. Refractive error and visual impairment in school-age children in Gombak District, Malaysia. Ophthalmology. 2005;112(4):678-85.
25. Vieira JK, Rezende GX, Anastácio LB, Freitas Filho RT, Benevides HCC, Fonseca JM, et al. Prevalence of visual disorders in school children. Rev Bras Oftalmol. 2018;77(4):175-9.
26. Czepita D, Mojsa A, Ustianowska M, Czepita M, Lachowicz E. Role of gender in the occurrence of refractive errors. Ann Acad Med Stetin. 2007;53(2):5‐7.
27. Guo L, Yang J, Mai J, Du X, Guo Y, Li P, et al. Prevalence and associated factors of myopia among primary and middle school-aged students: a school-based study in Guangzhou. Eye. 2016;30(6):796-804.
28. Gilbert C, Bowman R, Malik AN. The epidemiology of blindness in children: changing priorities. Community Eye Health. 2017;30(100):74-7.
29. Ribeiro L, Silva RM. Special education in Brazilian educational policies: A historical approach. Educ Policy Anal Arch. 2019;21.
30. Baptista CR. Public policy, Special Education and schooling in Brazil. Educ Pesqui. 2019;45:e217423.