
Time-course of adaptations for electroretinography and pupillography
Main Article Content
Abstract
Cones are primarily involved in photopic vision and light adaptation. Rods are responsible for scotopic vision and dark adaptation. The typical time-courses of light and dark adaptations have been known for century. However, information regarding the minimal adaptation time for electroretinography (ERG) and pupillography would be helpful for practical applications and clinical efficiency. Therefore, we investigated the relationship between adaptation time and the parameters of ERG and pupillography. Forty-six eyes of 23 healthy women (mean age, 21.7 years) were enrolled. ERG and pupillography were tested for right and left eyes, respectively. ERG with a skin electrode was used to determine amplitude (µV) and implicit time (msec) by the records of rod-, flash-, cone-, and flicker-responses with white light (0.01–30 cd·s/m2). Infrared pupillography was used to record the pupillary response to 1-sec stimulation of red light (100 cd/m2). Cone- and flicker- (rod-, flash-, and pupil) responses were recorded after light (dark) adaptation at 1, 5, 10, 15, and 20 min. Amplitude was significantly different between 1 min and ≥5 or ≥10 min after adaptation in b-wave of cone- or rod-response, respectively. Implicit time differed significantly between 1 min and ≥5 min after adaptation with b-wave of cone- and rod-response. There were significant differences between 1 min and ≥10 or ≥5 min after dark adaptation in parameter of minimum pupil diameter or constriction rate, respectively. Consequently, light-adapted ERGs can be recorded, even in 5 min of light adaptation time without special light condition, whereas dark-adapted ERGs and pupillary response results can be obtained in 10 min or longer of dark adaptation time in complete darkness.

1. Adaptation of retina and pupil
Cones and rods respond only to light falling on the retina from a specific direction. These allow them to detect the amount of light originating from a small point in the viewing space. They are the two types of photoreceptor cells which contribute to the duality of vision. Cones are primarily involved in photopic vision or vision in bright light, rods are responsible for scotopic vision or dark vision, and both types of cells are involved in mesopic vision or vision in dim lighting. Due to the distinct res ponses and characteristics of cones and rods, the eye can efficiently adapt to a wide range of lighting environments. When moving from a light (dark) environment to a dark (light) environment, it is initially difficult to see things clearly, but the eye ad justs with time. This is called dark (light) adaptation [1] . The process of light adaptation is usually completed extremely quickly and is known to be primarily dependent on neural sensitivity regulations such as α - adaptation through a neural process and t he subsequent β - adaptation through a photochemical process [2] . In contrast, dark adaptation occurs gradually, and the synthesis of photobleached rhodopsin is primarily responsible for this process [3] .
Electroretinography (ERG) and pupillography are the primary elements that are known to change in the light and dark. The evaluation of ERG is essential in the early discovery and treatment decision - making process for eye disorders that result in blindness [4] , and pupillary response is an important objective clinical finding of the autonomic nervous system [5] , emotion [6] , and fatigue [7] . For these reasons, accurate assessment of these elements is desired. However, both show large individual differences and the values obtained fluctuate due to phy siological noise [8] and hippus of biological origin [9] . Although the evaluation of ERG and pupillary response in the dark requires consideration of adaptation time, this is determined by the institution or examiner and no consensus has yet been reached.
The International Society for Clinical Electrophysiology of Vision (ISCEV) specifies the protocol for full - field clinical ERG as: “The recording conditions outlined below specify 20 min of dark adaptation before recording dark - adapted ERGs, and 10 min of l ight adaptation before recording light - adapted ERGs” [10] . These standards are good markers to determine adaptation time.
On the other hand, the pupil, which changes diameter between light and dark environments, shows less contribution to adaptation than d o cones and rods. The effects on dark adaptation - derived changes on the pupillary response during dark adaptation are given only minimal attention. In previous reports [11 - 22] , dark adaptation times have ranged widely from 10 sec to 30 min; however, the ra tionale for setting these specific times was unclear.
We therefore considered that not only various body fluctuations, but also discrepancies in adaptation time could be factors that decrease the accuracy of test results. Here, we described the relationshi p between adaptation time and the parameters of ERG and pupillography in 46 eyes of 23 young healthy women (age, 20 – 30 years). T he information regarding the minimal adaptation time for ERG and pupil measurements would be helpful for practical application a nd clinical efficiency.
2. Electroretinography
ERG with a skin electrode was performed using an LE - 4000 (Tomey Co., Nagoya, Japan) in the right eye (23 eyes). The pupil was dilated with a solution of 0.5% tropicamide and 0.5% phenylephrine hydrochloride (Mydrin - P, Santen Pharmaceutical Co., Osaka, Japan). Skin electrodes were attached to the lower eyelid, reference electrode to the forehead, and grounding electrode to the ear lobe. The cone - (8 responses), 30 Hz flick er - (50 responses), rod - (8 responses), and flash - response (4 responses) with white light (0.01 – 30 cd·s/m 2 ) were measured. Cone - and 30 Hz flicker - responses were recorded after light adaptation and rod - and flash - responses were recorded after dark adaptati on at 1, 5, 10, 15, and 20 min. Amplitude (μV) and implicit time (msec) were evaluated.
Table 1 summarizes (a) the amplitude and (b) the implicit time by adaptation time.
Table 1. Electroretinography by adaptation time
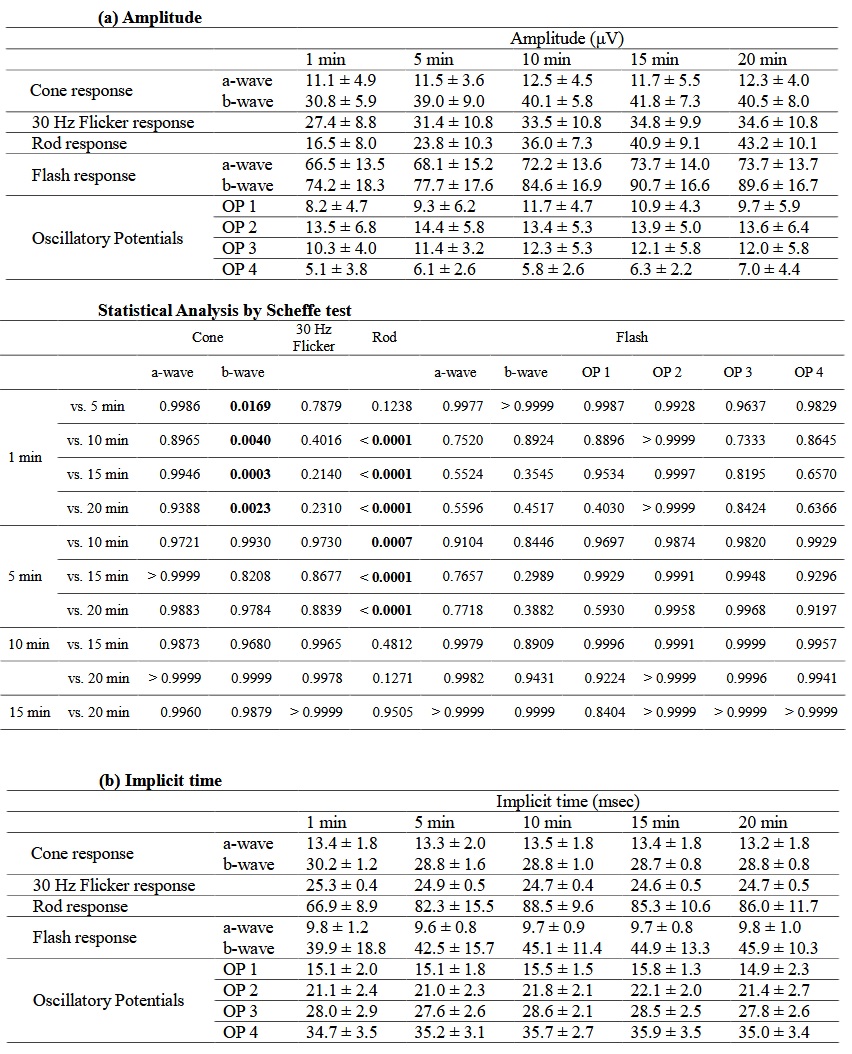
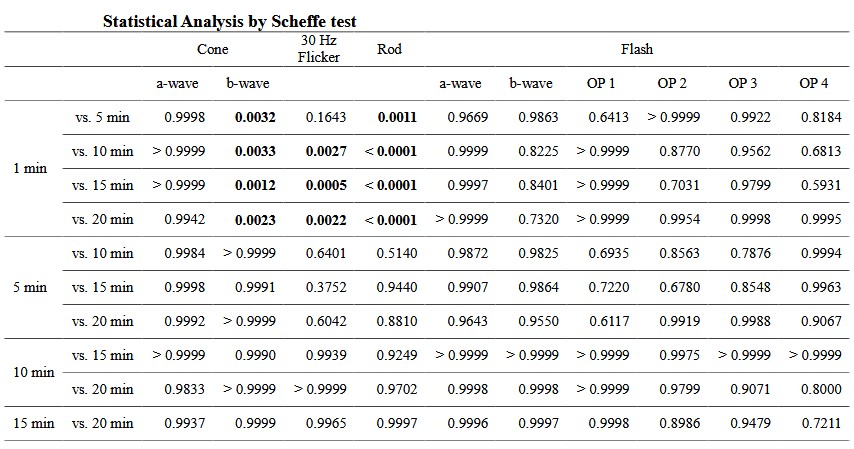
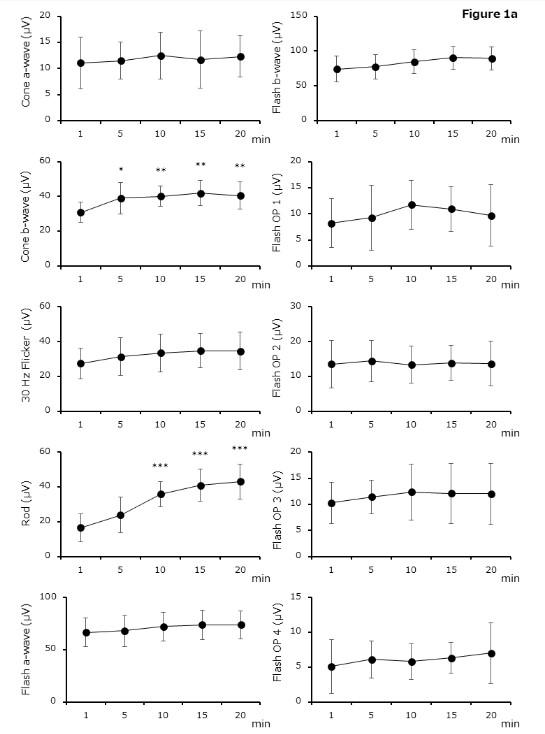
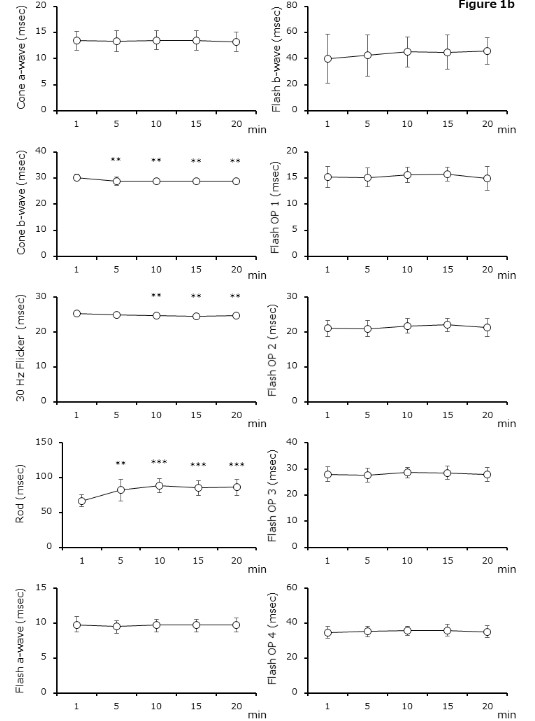
Figure 1. Electroretinography by adaptation time
( a ) Amplitude is significantly different between 1 min and ≥5 or ≥10 min after adaptation in b - wave of cone - response (1 min vs. 5 – 20 min, P = 0.0169 – P = 0.0003) or rod - response (1 min vs. 5 – 20 min, P = 0.1238 – P < 0.0001), respectively. (b) Implicit time differ ed significantly between 1 min and ≥5 min after adaptation with b - wave of cone - response ( 1 min vs. 5 – 20 min, P = 0.0012 – P = 0.0033) and rod - response ( 1 min vs. 5 – 20 min, P = 0.0011 – P < 0.0001). With 30 Hz flicker - response, significant differences are obser ved between 1 min and ≥10 min (1 min vs. 5 – 20 min, P = 0.1643 – P = 0.0005). Results are shown as mean ± standard deviations.
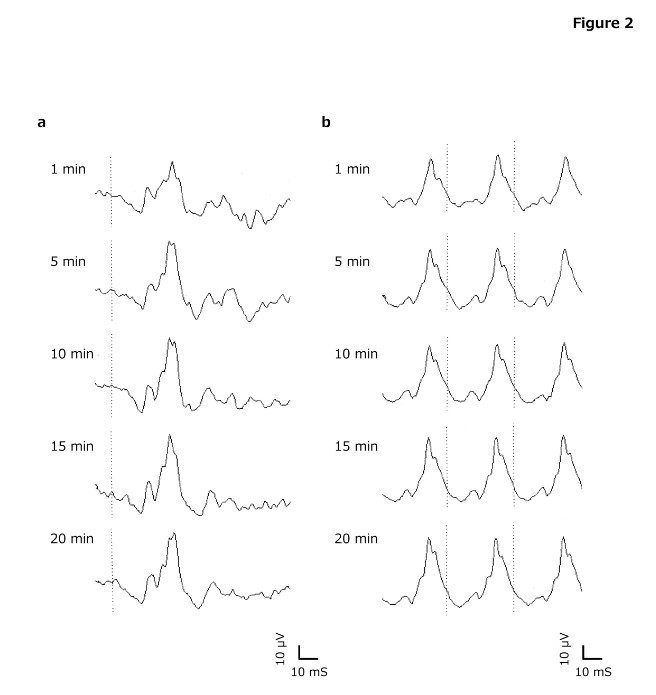
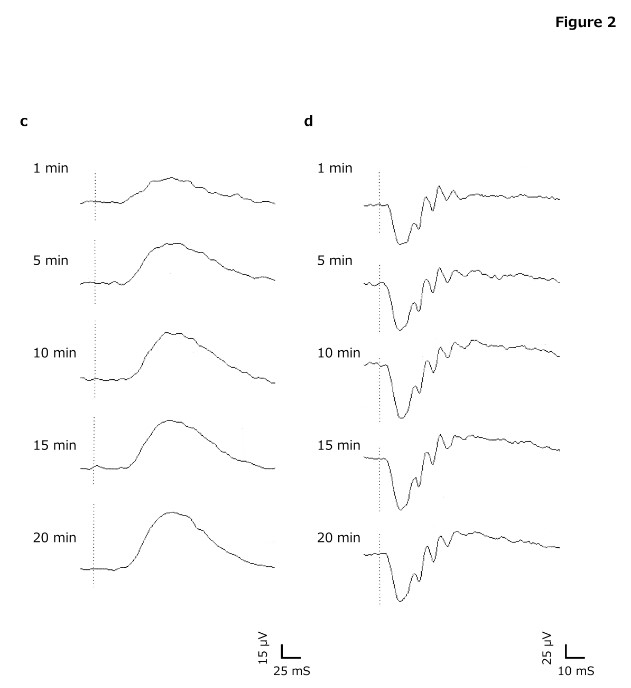
Figure 2. Typical waveforms of electroretinography (ERG)
(a) Cone, (b) 30 Hz Flicker, (c) Rod, (d) Flash. Light - adapted ERGs can be recorded even in 5 min of light adaptation time. Dark - adapted ERGs can be obtained in 10 min or longer of dark adaptation time.
Infrared pupillography (Iriscorder Dual C - 10641, Hamamatsu Photonics, Hamamatsu , Japan) was used to measure the pupillary light reflex to 1 - sec stimulation of 635 - nm red light (100 cd/m 2 ) at 1, 5, 10, 15, and 20 min after dark adaptation in the left eye (23 eyes). The following parameters of pupillary response were assessed: initial pupil diameter (D1, mm), minimum pupil diameter (D2, mm), constriction rate (CR, %), time from light stimuli to start of constriction (T1, msec), time required until pupil diamete r becomes half the size of initial pupil diameter (T2, msec), time required to reach minimum pupil diameter (T3, msec), time required to recover 63% of minimum pupil diameter (T5, msec), maximum velocity of constriction (VC, mm 2 /sec), maximum velocity of d ilation (VD, mm 2 /sec), and maximum acceleration of constriction (AC, mm 2 /sec 2 ).
Table 2. Pupillography by adaptation time
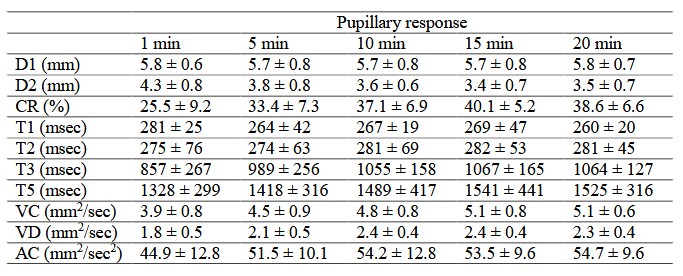
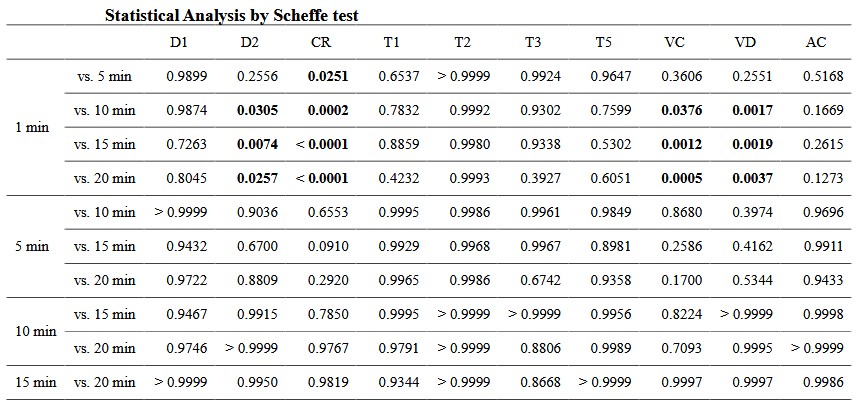
Table 2 presents a summary of the pupillary response by adaptation time. Results are shown as mean ± standard deviations. Statistical analyses (one - way ANOVA with the Scheffe test) in all the time - points are also shown. There were significant differences between 1 min and ≥10 or ≥5 min after dark adaptation in D2 (1min vs. 5, 10, 15, and 20 min, P = 0.2556 – P = 0.0074) or CR (P = 0.0251 – P < 0.0001). The parameters of VC and VD differed significantly between 1 min and ≥10 min after adaptation (P = 0.3606 – P = 0.0005 and P = 0.2551 – P = 0.0017). No differences between adaptation times were observed with D1, T1, T2, T3, T5, and AC parameters (P = 0.1273 – P > 0.9999) (Figure 3) . Figure 4 shows the typical waveforms.
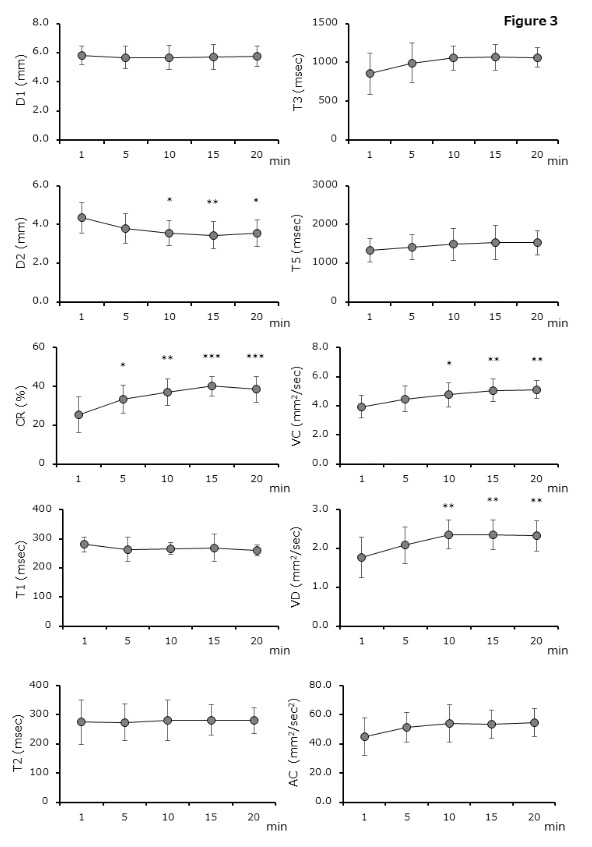
Figure 3. Pupillography by adaptation time
There are significant differences between 1 min and ≥10 or ≥5 min after dark adaptation in the parameter of minimum pupil diameter (D2) (1 min vs. 5 – 20 min, P = 0.2556 – P = 0.0074) or constriction rate (CR) (1 min vs. 5 – 20 min, P = 0.0251 – P < 0.0001), respectively. Results are shown as mean ± standard deviations.
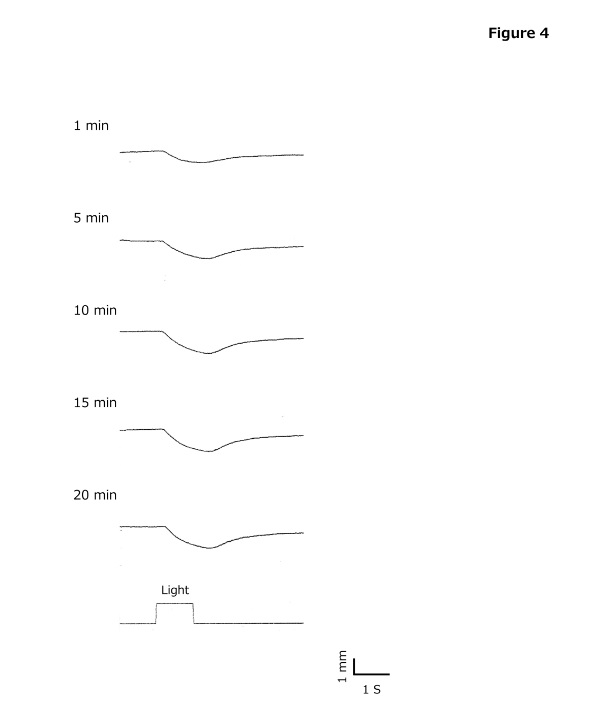
Figure 4. Typical waveforms of pupillography
Pupillary response can be obtained in 10 min or longer of dark adaptation time. 4. Dark adaptation curve Goldmann - Weekers dark adaptometer (Haag - Streit , Switzerland) was used to assess time - dependent changes light perception threshold in total and partial retina conditions after 10 min of 2,000 - asb light adaptation with 8 subjects chosen randomly. The dark adaptation curve is shown in Figure 5 . Results ar e shown as mean ± standard deviations. In the total (partial) retina conditions, the rod - cone break was observed after 7 ± 3 (7 ± 2) min. Thresholds with dark adaptation times changed in the following manner: 10 6.7 (5.8) at the first response point (30 sec after starting measurement), 10 6.1 (5.4) at 1 min after dark adaptation, 10 5.4 (4.5) at 5 min, 10 4.5 (3.5) at 10 min, 10 4.1 (3.0) at 15 min, and 10 3.7 (2.8) at 20 min. In both conditions, the final threshold after 39 ± 7 min of dark adaptation was recorde d approximately 2 logs lower than the threshold at the rod - cone break.
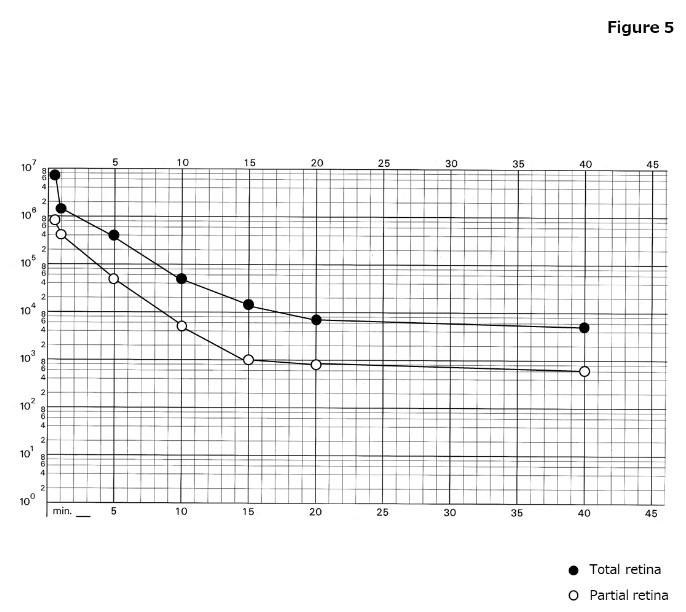
Figure 5. Dark adaptation curve
(●) Total retina, (○) Partial retina. The horizontal axis represents time in dark and the vertical axis represents the log threshold. In the total (partial) retina conditions, the rod - cone break is observed after 7 (7) min. Thresholds with dark adaptation times changes in the following manner: 10 6.1 (5.4) at 1 min, 10 5.4 (4.5) at 5 min, 10 4.5 (3.5) at 10 min , 10 4.1 (3.0) at 15 min, and 10 3.7 (2.8) at 20 min after dark adaptation.
5. Adaptation time for electroretinography and pupillography
The typical time - courses of light and dark adaptations have been known for century. Factors associated with adaptation of retina include: photobleaching and synthesis of rhodopsin and three types of opsin contained in photoreceptor cells [1] , chemical change in the response character istics of photoreceptor cells [23] , and reconstruction of a neural network consisting of bipolar cells and retinal ganglion cells [24] . According to Rushton et al. [25] , the threshold is not simply determined by the rhodopsin concentration alone. Comparing the rhodopsin synthesis rate of 90% and 100%, the rhodopsin concentration increases 1.1 - fold, but the threshold becomes 1/100 (i.e., sensitivity increases 100 - fold). This indicates that adaptation occurs within a different pathway in addition to changes i n rhodopsin concentration. Nonetheless, the dark adaptation process shows a linear relationship with the rhodopsin synthesis process. The response curves of cones and rods, known as multiplicative adaptations, shift depending on the intensity of the adapta tion background according to an electrophysiological experiment by Normann et al. [26] . For example, when the intensity of background light is increased 10 - fold, a similar response cannot be obtained unless the target light intensity is also increased 10 - f old. Multiplicative adaptation takes place within a short period of time, but occurs through chemical changes such as the opening and closing of ion channels at the photoreceptor cell outer segment [23, 24] . Retinal ganglion cells, which exist at the final level of light transmission in the retina, possess a receptive field structure. This structure changes depending on the status of adaptation. Glezer [27] demonstrated in a psychophysical experiment that these cells possess a receptive field structure with an ON center - OFF surrounding. When the adaptation level is low, retinal ganglion cells bind extensively to surrounding photoreceptor cells in an excitatory state, thereby efficiently using even small amounts of light; however, when the adaptation level is high, the binding range narrows, and the cells bind to nearby photoreceptor cells in an inhibitory manner, resulting in a structure suitable for maximizing spatial resolution. Adaptation through the reconstruction of the neural network plays dual roles of responding to light/dark changes in the visual environment and improving visual spatial resolution.
In the present study , prior to the ERG measurement, a survey and routine vision exams were conducted in an examination room with approximately 550 lx of light. Photobleaching of rhodopsin occurring through this light environment, and synthesis began after switching to a dark environment. The rod - cone break was observed after about 7 min in the dark adaptation curve. Because the dark adaptation process has a linear correlation with the rhodopsin synthesis, the rod - cone break approximately 10 min after dark adaptation, and the results of the dark - adapted ERG were consistent. Our findings showed that stabilization of rod responses, occurring at ≥10 min after dark adaptation, was related to the synthesis of rhodopsin.
Contrastingly, in the natural level of photopic vision, sensitiv ity regulation is dependent on the phototransduction cascade of photoreceptor cells and on the network processing of retinal ganglion cells rather than on the photobleaching of rhodopsin and completes the regulation extremely quickly. Basic experiments hav e also demonstrated that when light intensity nears the maximum, the shift in the adaptation response curve reaches the limit, resulting in the photobleaching of rhodopsin and saturation of rod responses [26] . The level in which rod saturation occurs is ap proximately 2,000 – 5,000 scotopic·Td [28] . This scotopic retinal illuminance is converted to approximately 120 – 300 cd/m 2 of daylight photopic vision luminance where the rod response is mostly saturated in the natural level of photopic vision (e.g., 1.5 min at 185 cd/m 2 ) [29] . Therefore, with the light - adapted ERG, the amplitude and implicit times were generally good even at 1 min after light adaptation, and both had stabilized by 5 min, indicating that assessment was fully feasible without specifically emplo ying a long period of light adaptation (e.g., 10 min at 30 cd/m 2 ) [10] .
The pupil changes diameter between light and dark environments and controls the amount of light that reaches the retina. Due to their physiological characteristics and the autonomic nervous system, dark adaptation is necessary before measurement, and the measurement itself is also typically performed in the dark. Moreover, the pupillary response to 1 - sec stimulation of red light is primarily driven by cones and rods [30 - 33] . However, dark adaptation times have ranged widely from 10 sec to 30 min in previous reports [11 - 22] . Wang et al. [16] showed a significantly increased pupillary response during dark adaptation and recommended a period of 20 min of dark adaptation.
In the present st udy, D2 was the smallest and CR was the largest ≥10 min after dark adaptation, but the other parameters obtained did not differ based on time in the dark. The sensitivity of photoreceptor cells differs depending on the color of the stimulating light. Cones detect light in 380 – 720 nm. Maximum sensitivities are reached on the spectral sensitivity curve with light wavelengths of approximately 555 nm in photopic vision and approximately 505 nm in scotopic vision. Rods do not sense colors but only sense light at 380 – 650 nm. However, with short - to medium - wavelength light, the threshold of cones that sense the unique color (i.e., wavelength) of the stimulating light is greater than the threshold of rods that only sense light, and the shorter the wavelength, the gr eater the sensitivity of the rods compared to cones (i.e., photochromatic interval) [34] . In contrast, cones and rods have nearly the equivalent sensitivity for long - wavelength light. Thus, there is no photochromatic interval under such a setting. The para meters obtained of pupillary response are likely responses derived from both cones and rods because red light of 635 nm was used as the stimulus in this study. T2 and T3 are parameters that reflect the parasympathetic nerve, while T5 is reflects the sympat hetic nerve [35] . As these did not significantly differ in adaptation time, we deduced that adaptation and the autonomic nervous system are minimally associated.
D1 was 5.7 – 5.8 mm at any dark adaptation time, reflecting the state of the pupil that is relea sed from the autonomic nervous regulation. Yamaji et al. [36] reported in rabbits that strength (passive tension) for the pupillary sphincter (pupillary dilator) to return to the baseline state increases when the pupil diameter becomes larger or smaller. W hen the two muscle strengths balance each other and the tension is zero, the pupil diameter is equivalent to approximately 6 mm in humans. This size is the physically stabilized state of a pupil free from the control of the autonomic nervous system. Moreov er, the pupil diameter under conditions of brain death is 5.7 ± 1.2 mm, representing a median distribution of about 6 mm [37] . Brain death is a state in which autonomic nervous function is halted, and a diameter of approximately 6 mm is therefore presumed to result when the pupil is released from the control of the autonomic nervous system. The D1 results corroborate these reports. D2 differed significantly 10 min after dark adaptation and CR was significantly different 5 min after dark adaptation. One fact or involved in the time - dependent reduction of pupil diameter is the supranuclear inhibitory element against the Edinger - Westphal (E - W) nucleus [38] . When the supranuclear inhibitory element is removed and the cells of the E - W nucleus are in an excited sta te (overactivated), a reduction in pupil diameter occurs, similarly to a mechanism in which the pupil constricts during fatigue or sleep. However, D1 is also thought to shrink with this factor. Therefore, the most important points of this study were that w e found an even greater reduction was induced due to the rhodopsin synthesis, indicating that ≥10 min of dark adaptation is required for pupil testing.
There are two limitations in this study. Only young healthy women were evaluated because age and gender differences tend to affect the ERG amplitude and pupillary response, therefore these results may not be generalizable in other populations. Another limitation is that the application of these results to patients with an eye disorder remains unknown.
6. Conclusions
We found that a natural light environment is sufficient for photopic vision and that light - adapted ERGs can be recorded, even in 5 min of light adaptation time. Furthermore, dark - adapted ERGs and pupillary response results can be obtained in 10 min or longer of dark adaptation time in complete darkness.
Acknowledgements
The authors thank Akari Ito and Haruka Yamashita of Kitasato University and Yuuki Nakayama and Yousuke Horiuchi of Uni - Hite Corporation, for assistance with data collection; an d Robert E. Brandt of MedEd Japan, for editing and formatting the manuscript. This study was supported by a grant from Kitasato University School of Allied Health Sciences Grant in - Aid for Research Project, grant number 2018 - 1041 and by JSPS KAKENHI grant number 20K12720.
Statement of human rights
This study was approved by the Research Ethics Committee of Kitasato University School of Allied Health Sciences (number: 2018 - 001). All research procedures performed in this study were in accordance with the et hical standards of the institutional and/or the national research committee and with the 1964 Helsinki declaration and its later amendments or comparable ethical standards.
Informed consent
Informed consent was obtained from all the subjects in this stud y.
Conflict of interest
The authors declare that they have no conflicts of interest.
Article Details
The Medical Research Archives grants authors the right to publish and reproduce the unrevised contribution in whole or in part at any time and in any form for any scholarly non-commercial purpose with the condition that all publications of the contribution include a full citation to the journal as published by the Medical Research Archives.
References
doi: 10.1085/jgp.2.5.499.
2. Schouten JF, Ornstein LS. Measurements on direct and indirect adaptation by means of a binocular method. J Opt Soc Am. 1939 April 1;29(4):168-182. doi:10.1364/JOSA.29.000168.
3. Wald G, Clark AB. Visual adaptation and chemistry of the rods. J Gen Physiol. 1937 Sep 20;21(1):93-105. doi: 10.1085/jgp.21.1.93.
4. Karpe G. Apparatus and method for clinical recording of the electroretinogram. Doc Ophthalmol. 1948 Jan;2(1):268-276.
doi: 10.1007/BF00204534.
5. McDougal DH, Gamlin PD. Autonomic control of the eye. Compr Physiol. 2015 Jan;5(1):439-473.
doi: 10.1002/cphy.c140014.
6. Lowenstein O, Feinberg R, Lowenfeld IE. Pupillary movements during acute and chronic fatigue: A new test for the objective evaluation of tiredness. Invest Ophthalmol Vis Sci. 1963 April;2(2):138-157.
7. Wilhelm B, Giedke H, Ludtke H, Bittner E, Hofmann A, Wilhelm H. Daytime variations in central nervous system activation measured by a pupillographic sleepiness test. J Sleep Res. 2001 Mar;10(1):1-7. doi: 10.1046/j.1365-2869.2001.00239.x.
8. Yamashita T, Miki A, Tabuchi A, Funada H, Kondo M. A novel method to reduce noise in electroretinography using skin electrodes: a study of noise level, inter-session variability, and reproducibility. Int Ophthalmol. 2017 Apr;37(2):317-324. doi: 10.1007/s10792-016-0240-5.
9. Thompson HS, Franceschetti AT, Thompson PM. Hippus. Semantic and historic considerations of the word. Am J Ophthalmol. 1971 May;71(5):1116-1120. PMID: 4935041
10. McCulloch DL, Marmor MF, Brigell MG, Hamilton R, Holder GE, Tzekov R, et al. ISCEV Standard for full-field clinical electroretinography (2015 update). Doc Ophthalmol. 2015 Feb;130(1):1-12. doi: 10.1007/s10633-014-9473-7.
11. Fotiou F, Fountoulakis KN, Goulas A, Alexopoulos L, Palikaras A. Automated standardized pupillometry with optical method for purposes of clinical practice and research. Clin Physiol. 2000 Sep;20(5):336-347. doi: 10.1046/j.1365-2281.2000.00259.x.
12. Schnitzler EM, Baumeister M, Kohnen T. Scotopic measurement of normal pupils: Colvard versus Video Vision Analyzer infrared pupillometer. J Cataract Refract Surg. 2000 Jun;26(6):859-866.
doi: 10.1016/s0886-3350(00)00486-7.
13. Bradley JC, Bentley KC, Mughal AI, Bodhireddy H, Young RS, Brown SM. The effect of gender and iris color on the dark-adapted pupil diameter. J Ocul Pharmacol Ther. 2010 Aug;26(4):335-340. doi: 10.1089/jop.2010.0061.
14. Lorenz B, Strohmayr E, Zahn S, Friedburg C, Kramer M, Preising M, et al. Chromatic pupillometry dissects function of the three different light-sensitive retinal cell populations in RPE65 deficiency. Invest Ophthalmol Vis Sci. 2012 Aug 17;53(9):5641-5652. doi: 10.1167/iovs.12-9974.
15. Bremner FD. Pupillometric evaluation of the dynamics of the pupillary response to a brief light stimulus in healthy subjects. Invest Ophthalmol Vis Sci. 2012 Oct 23;53(11):7343-7347. doi: 10.1167/iovs.12-10881.
16. Wang B, Shen C, Zhang L, Qi L, Yao L, Chen J, et al. Dark adaptation-induced changes in rod, cone and intrinsically photosensitive retinal ganglion cell (ipRGC) sensitivity differentially affect the pupil light response (PLR). Graefes Arch Clin Exp Ophthalmol. 2015 Nov;253(11):1997-2005. doi: 10.1007/s00417-015-3137-5.
17. Traustason S, Brondsted AE, Sander B, Lund-Andersen H. Pupillary response to direct and consensual chromatic light stimuli. Acta Ophthalmol. 2016 Feb;94(1):65-69. doi: 10.1111/aos.12894.
18. Satou T, Ishikawa H, Asakawa K, Goseki T, Shimizu K. Effects of ripasudil hydrochloride hydrate instillation on pupil dynamics. Curr Eye Res. 2017 Jan;42(1):54-57. doi: 10.3109/02713683.2016.1148740.
19. Yuhas PT, Shorter PD, McDaniel CE, Earley MJ, Hartwick AT. Blue and red light-evoked pupil responses in photophobic subjects with TBI. Optom Vis Sci. 2017 Jan;94(1):108-117. doi: 10.1097/OPX.0000000000000934.
20. Lisowska J, Lisowski L, Kelbsch C, Maeda F, Richter P, Kohl S, et al. Development of a chromatic pupillography protocol for the first gene therapy trial in patients with CNGA3-linked achromatopsia. Invest Ophthalmol Vis Sci. 2017 Feb 1;58(2):1274-1282. doi: 10.1167/iovs.16-20505.
21. Lawlor M, Quartilho A, Bunce C, Nathwani N, Dowse E, Kamal D, et al. Patients with normal tension glaucoma have relative sparing of the relative afferent pupillary defect compared to those with open angle glaucoma and elevated intraocular pressure. Invest Ophthalmol Vis Sci. 2017 Oct 1;58(12):5237-5241. doi: 10.1167/iovs.17-21688.
22. Crippa SV, Pedrosa Domellöf F, Kawasaki A. Chromatic pupillometry in children. Front Neurol. 2018 Aug 17;9:669. doi: 10.3389/fneur.2018.00669.
23. Baylor DA, Nunn BJ, Schnapf JL. The photocurrent, noise and spectral sensitivity of rods of the monkey Macaca fascicularis. J Physiol. 1984 Dec;357:575-607. doi: 10.1113/jphysiol.1984.sp015518.
24. Pugh E, Altman J. Phototransduction. A role for calcium in adaptation. Nature 1988 Jul 7;334(6177):16-17. doi: 10.1038/334016a0.
25. Rushton WA. Rhodopsin measurement and dark-adaptation in a subject deficient in cone vision. J Physiol. 1961 Apr;156 (1):193-205. doi: 10.1113/jphysiol.1961.sp006668.
26. Normann RA, Werblin FS. Control of retinal sensitivity. I. Light and dark adaptation of vertebrate rods and cones. J Gen Physiol. 1974 Jan;63(1):37-61. doi: 10.1085/jgp.63.1.37.
27. Glezer VD. The receptive fields of the retina. Vision Res. 1965 Oct;5(9):497-525. doi: 10.1016/0042-6989(65)90084-2.
28. Aguilar M, Stiles WS. Saturation of the rod mechanism of the retina at high levels of stimulation. Optica Acta. 1954 Jan;1(1):59-65. doi: 10.1080/713818657.
29. Baker HD. The course of foveal light adaptation measured by the threshold intensity increment. J Opt Soc Am. 1949 Feb;39(2):172-179. doi: 10.1364/josa.39.000172.
30. Gamlin PD, McDougal DH, Pokorny J, Smith VC, Yau KW, Dacey DM. Human and macaque pupil responses driven by melanopsin-containing retinal ganglion cells. Vision Res. 2007 Mar;47(7):946-954. doi: 10.1016/j.visres.2006.12.015.
31. Kardon R, Anderson SC, Damarjian TG, Grace EM, Stone E, Kawasaki A. Chromatic pupil responses: preferential activation of the melanopsin-mediated versus outer photoreceptor-mediated pupil light reflex. Ophthalmology 2009 Aug;116(8):1564-1573. doi: 10.1016/j.ophtha.2009.02.007.
32. Asakawa K, Ishikawa H, Uga S, Mashimo K, Shimizu K, Kondo M, et al. Functional and morphological study of retinal photoreceptor cell degeneration in transgenic rabbits with a Pro347Leu rhodopsin mutation. Jpn J Ophthalmol 2015 Sep;59(5):353-363. doi: 10.1007/s10384-015-0400-6.
33. Asakawa K, Ishikawa H. Electroretinography and pupillography in unilateral foveal hypoplasia. J Pediatr Ophthalmol Strabismus. 2016 Jun 3;53:26-28. doi: 10.3928/01913913-20160509-04.
34. Lie I. Dark adaptation and the photochromatic interval. Doc Ophthalmol. 1963 Jan 1;17:411-510. doi: 10.1007/BF00573528.
35. Yanagisawa Y, Yoshino H, Ishikawa S, Miyata M. Chemical sensitivity and sick-building syndrome. CRC Press, Boca Raton, FL, USA. 2017.
36. Yamaji K, Yoshitomi T, Usui S, Ohnishi Y. Mechanical properties of the rabbit iris smooth muscles. Vision Res. 2003 Feb;43(4):479-487. doi: 10.1016/s0042-6989(02)00574-6.
37. Tsujisawa I, Mukuno K, Ishikawa S. The pupillary change in the course of brain death. J Auton Nerv Syst. 1989 Feb;26(1):63-70 (in Japanese).
38. Lowenstein O. Pupillary reflex shapes and topical clinical diagnosis. Neurology 1955 Sep;5(9):631-644. doi: 10.1212/wnl.5.9.631.